Serbian vs Comanche Child Poverty Under the Age of 16
COMPARE
Serbian
Comanche
Child Poverty Under the Age of 16
Child Poverty Under the Age of 16 Comparison
Serbians
Comanche
14.8%
CHILD POVERTY UNDER THE AGE OF 16
94.5/ 100
METRIC RATING
106th/ 347
METRIC RANK
19.9%
CHILD POVERTY UNDER THE AGE OF 16
0.0/ 100
METRIC RATING
280th/ 347
METRIC RANK
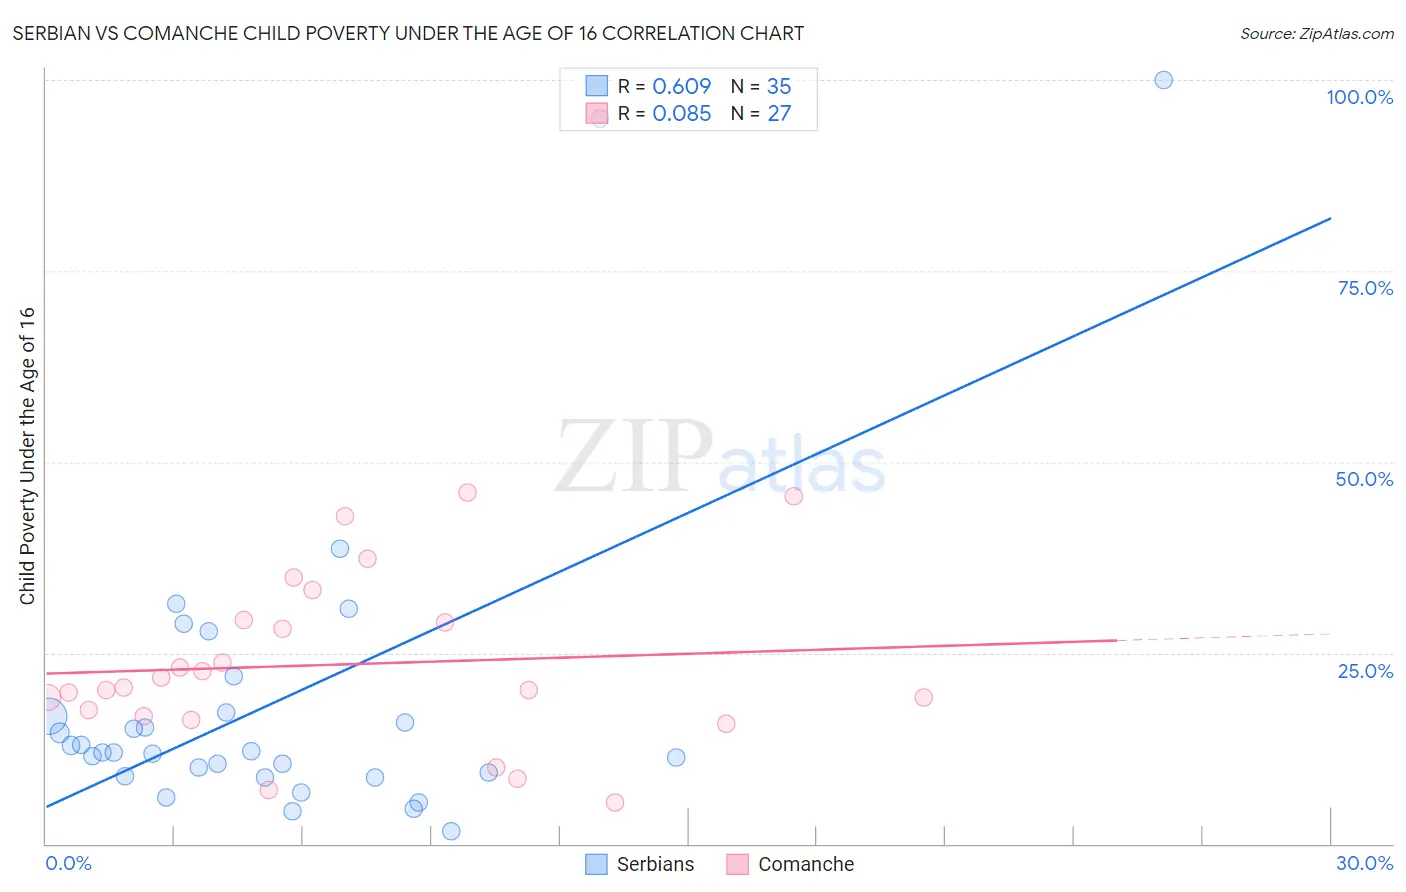
Serbian vs Comanche Child Poverty Under the Age of 16 Correlation Chart
The statistical analysis conducted on geographies consisting of 265,642,199 people shows a significant positive correlation between the proportion of Serbians and poverty level among children under the age of 16 in the United States with a correlation coefficient (R) of 0.609 and weighted average of 14.8%. Similarly, the statistical analysis conducted on geographies consisting of 109,572,547 people shows a slight positive correlation between the proportion of Comanche and poverty level among children under the age of 16 in the United States with a correlation coefficient (R) of 0.085 and weighted average of 19.9%, a difference of 34.3%.
Child Poverty Under the Age of 16 Correlation Summary
| Measurement | Serbian | Comanche |
| Minimum | 1.6% | 5.4% |
| Maximum | 100.0% | 46.0% |
| Range | 98.4% | 40.6% |
| Mean | 18.9% | 23.5% |
| Median | 12.0% | 20.5% |
| Interquartile 25% (IQ1) | 8.9% | 16.7% |
| Interquartile 75% (IQ3) | 17.2% | 29.3% |
| Interquartile Range (IQR) | 8.4% | 12.6% |
| Standard Deviation (Sample) | 21.4% | 11.0% |
| Standard Deviation (Population) | 21.1% | 10.8% |
Similar Demographics by Child Poverty Under the Age of 16
Demographics Similar to Serbians by Child Poverty Under the Age of 16
In terms of child poverty under the age of 16, the demographic groups most similar to Serbians are Chilean (14.8%, a difference of 0.060%), Basque (14.8%, a difference of 0.13%), Jordanian (14.8%, a difference of 0.15%), Tlingit-Haida (14.9%, a difference of 0.22%), and Immigrants from England (14.8%, a difference of 0.24%).
| Demographics | Rating | Rank | Child Poverty Under the Age of 16 |
| British | 95.5 /100 | #99 | Exceptional 14.7% |
| Dutch | 95.1 /100 | #100 | Exceptional 14.8% |
| Immigrants | Switzerland | 95.1 /100 | #101 | Exceptional 14.8% |
| Romanians | 95.0 /100 | #102 | Exceptional 14.8% |
| Immigrants | Egypt | 94.9 /100 | #103 | Exceptional 14.8% |
| Immigrants | England | 94.8 /100 | #104 | Exceptional 14.8% |
| Basques | 94.7 /100 | #105 | Exceptional 14.8% |
| Serbians | 94.5 /100 | #106 | Exceptional 14.8% |
| Chileans | 94.4 /100 | #107 | Exceptional 14.8% |
| Jordanians | 94.2 /100 | #108 | Exceptional 14.8% |
| Tlingit-Haida | 94.1 /100 | #109 | Exceptional 14.9% |
| English | 93.5 /100 | #110 | Exceptional 14.9% |
| Immigrants | Denmark | 93.5 /100 | #111 | Exceptional 14.9% |
| Irish | 93.4 /100 | #112 | Exceptional 14.9% |
| Belgians | 93.3 /100 | #113 | Exceptional 14.9% |
Demographics Similar to Comanche by Child Poverty Under the Age of 16
In terms of child poverty under the age of 16, the demographic groups most similar to Comanche are Bangladeshi (19.9%, a difference of 0.010%), Subsaharan African (19.9%, a difference of 0.010%), Iroquois (19.9%, a difference of 0.11%), Immigrants from Cabo Verde (19.9%, a difference of 0.25%), and Immigrants from Barbados (19.9%, a difference of 0.25%).
| Demographics | Rating | Rank | Child Poverty Under the Age of 16 |
| Immigrants | Jamaica | 0.1 /100 | #273 | Tragic 19.8% |
| Immigrants | Cabo Verde | 0.1 /100 | #274 | Tragic 19.9% |
| Immigrants | Barbados | 0.1 /100 | #275 | Tragic 19.9% |
| Belizeans | 0.1 /100 | #276 | Tragic 19.9% |
| Iroquois | 0.1 /100 | #277 | Tragic 19.9% |
| Bangladeshis | 0.0 /100 | #278 | Tragic 19.9% |
| Sub-Saharan Africans | 0.0 /100 | #279 | Tragic 19.9% |
| Comanche | 0.0 /100 | #280 | Tragic 19.9% |
| Central Americans | 0.0 /100 | #281 | Tragic 20.0% |
| Barbadians | 0.0 /100 | #282 | Tragic 20.0% |
| Immigrants | Zaire | 0.0 /100 | #283 | Tragic 20.1% |
| West Indians | 0.0 /100 | #284 | Tragic 20.1% |
| Immigrants | St. Vincent and the Grenadines | 0.0 /100 | #285 | Tragic 20.1% |
| Immigrants | West Indies | 0.0 /100 | #286 | Tragic 20.2% |
| Blackfeet | 0.0 /100 | #287 | Tragic 20.2% |