Immigrants from Eritrea vs French American Indian Family Poverty
COMPARE
Immigrants from Eritrea
French American Indian
Family Poverty
Family Poverty Comparison
Immigrants from Eritrea
French American Indians
9.9%
FAMILY POVERTY
5.4/ 100
METRIC RATING
219th/ 347
METRIC RANK
10.2%
FAMILY POVERTY
1.5/ 100
METRIC RATING
238th/ 347
METRIC RANK
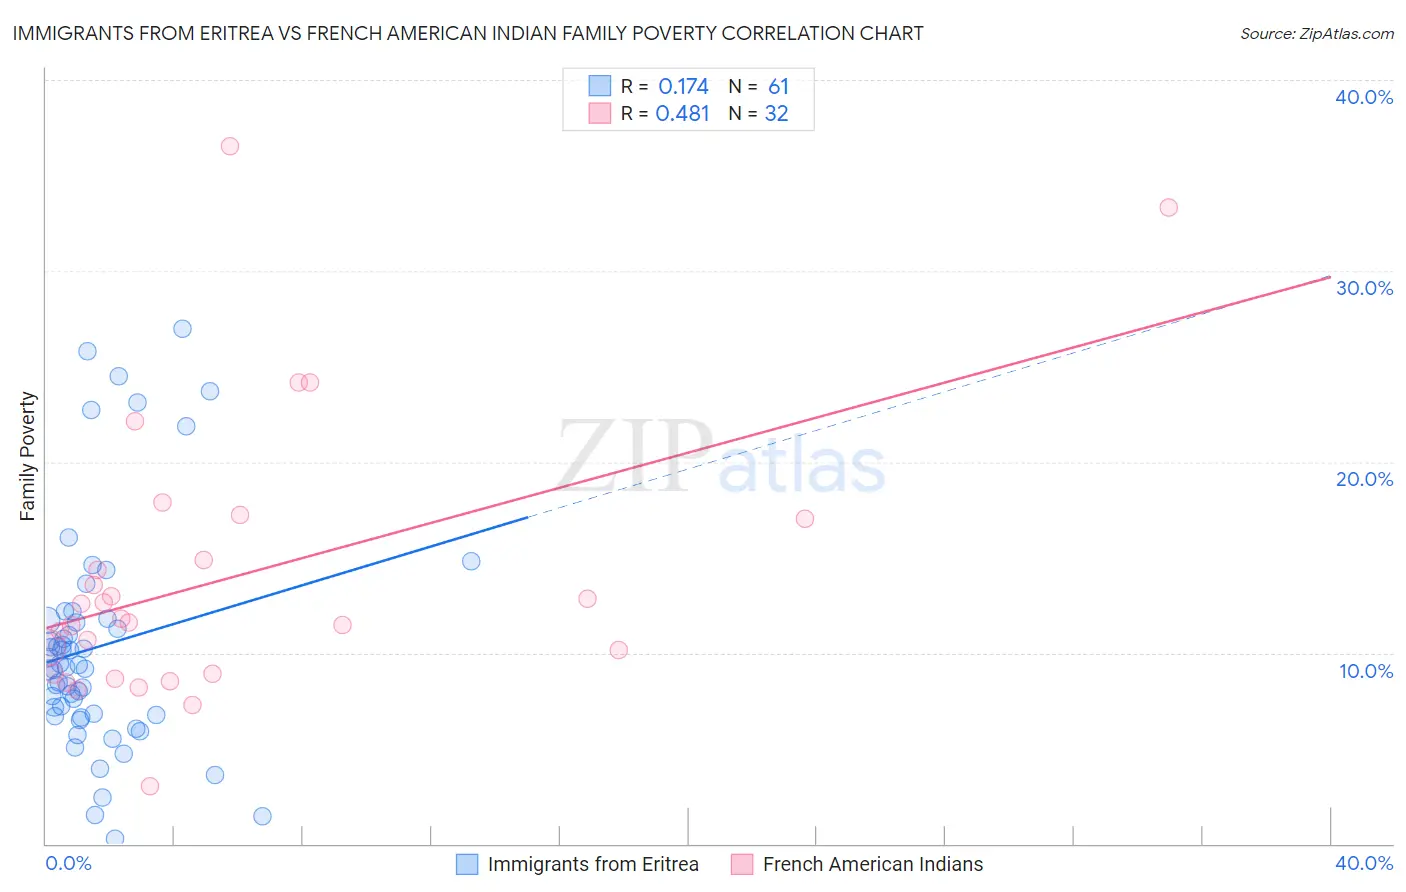
Immigrants from Eritrea vs French American Indian Family Poverty Correlation Chart
The statistical analysis conducted on geographies consisting of 104,784,674 people shows a poor positive correlation between the proportion of Immigrants from Eritrea and poverty level among families in the United States with a correlation coefficient (R) of 0.174 and weighted average of 9.9%. Similarly, the statistical analysis conducted on geographies consisting of 131,838,011 people shows a moderate positive correlation between the proportion of French American Indians and poverty level among families in the United States with a correlation coefficient (R) of 0.481 and weighted average of 10.2%, a difference of 3.9%.
Family Poverty Correlation Summary
| Measurement | Immigrants from Eritrea | French American Indian |
| Minimum | 0.28% | 3.0% |
| Maximum | 27.0% | 36.5% |
| Range | 26.7% | 33.5% |
| Mean | 10.3% | 13.9% |
| Median | 9.2% | 11.7% |
| Interquartile 25% (IQ1) | 6.7% | 8.9% |
| Interquartile 75% (IQ3) | 11.7% | 16.0% |
| Interquartile Range (IQR) | 5.0% | 7.1% |
| Standard Deviation (Sample) | 6.0% | 7.3% |
| Standard Deviation (Population) | 5.9% | 7.2% |
Demographics Similar to Immigrants from Eritrea and French American Indians by Family Poverty
In terms of family poverty, the demographic groups most similar to Immigrants from Eritrea are Bermudan (9.9%, a difference of 0.060%), Panamanian (9.8%, a difference of 0.13%), Immigrants from Cambodia (9.9%, a difference of 0.33%), Japanese (9.9%, a difference of 0.36%), and Immigrants from Africa (9.9%, a difference of 0.66%). Similarly, the demographic groups most similar to French American Indians are Immigrants from Laos (10.2%, a difference of 0.36%), Immigrants from Nigeria (10.2%, a difference of 0.63%), Nigerian (10.1%, a difference of 0.88%), Immigrants from Middle Africa (10.1%, a difference of 0.91%), and Fijian (10.1%, a difference of 1.0%).
| Demographics | Rating | Rank | Family Poverty |
| Panamanians | 5.6 /100 | #218 | Tragic 9.8% |
| Immigrants | Eritrea | 5.4 /100 | #219 | Tragic 9.9% |
| Bermudans | 5.3 /100 | #220 | Tragic 9.9% |
| Immigrants | Cambodia | 4.8 /100 | #221 | Tragic 9.9% |
| Japanese | 4.8 /100 | #222 | Tragic 9.9% |
| Immigrants | Africa | 4.3 /100 | #223 | Tragic 9.9% |
| Marshallese | 3.9 /100 | #224 | Tragic 9.9% |
| Immigrants | Immigrants | 3.6 /100 | #225 | Tragic 10.0% |
| Ottawa | 3.3 /100 | #226 | Tragic 10.0% |
| Immigrants | Armenia | 3.3 /100 | #227 | Tragic 10.0% |
| Sudanese | 3.1 /100 | #228 | Tragic 10.0% |
| Immigrants | Uzbekistan | 3.1 /100 | #229 | Tragic 10.0% |
| Immigrants | Panama | 3.1 /100 | #230 | Tragic 10.0% |
| Alaskan Athabascans | 2.7 /100 | #231 | Tragic 10.1% |
| Immigrants | Sudan | 2.3 /100 | #232 | Tragic 10.1% |
| Fijians | 2.1 /100 | #233 | Tragic 10.1% |
| Immigrants | Middle Africa | 2.1 /100 | #234 | Tragic 10.1% |
| Nigerians | 2.0 /100 | #235 | Tragic 10.1% |
| Immigrants | Nigeria | 1.9 /100 | #236 | Tragic 10.2% |
| Immigrants | Laos | 1.7 /100 | #237 | Tragic 10.2% |
| French American Indians | 1.5 /100 | #238 | Tragic 10.2% |