Ecuadorian vs Tlingit-Haida Receiving Food Stamps

COMPARE

Ecuadorian
Race
Ancestry
AfghanAfricanAlaska NativeAlaskan AthabascanAlbanianAleutAlsatianAmericanApacheArabArapahoArgentineanArmenianAssyrian/Chaldean/SyriacAustralianAustrianBahamianBangladeshiBarbadianBasqueBelgianBelizeanBermudanBhutaneseBlackfeetBolivianBrazilianBritishBritish West IndianBulgarianBurmeseCajunCambodianCanadianCape VerdeanCarpatho RusynCelticCentral AmericanCentral American IndianCherokeeCheyenneChickasawChileanChineseChippewaChoctawColombianColvilleComancheCosta RicanCreeCreekCroatianCrowCubanCypriotCzechCzechoslovakianDanishDelawareDominicanDutchDutch West IndianEastern EuropeanEcuadorianEgyptianEnglishEstonianEthiopianEuropeanFijianFilipinoFinnishFrenchFrench American IndianFrench CanadianGermanGerman RussianGhanaianGreekGuamanian/ChamorroGuatemalanGuyaneseHaitianHmongHonduranHopiHoumaHungarianIcelanderIndian (Asian)IndonesianInupiatIranianIraqiIrishIroquoisIsraeliItalianJamaicanJapaneseJordanianKenyanKiowaKoreanLaotianLatvianLebaneseLiberianLithuanianLumbeeLuxembourgerMacedonianMalaysianMalteseMarshalleseMenomineeMexicanMexican American IndianMongolianMoroccanNative HawaiianNavajoNepaleseNew ZealanderNicaraguanNigerianNorthern EuropeanNorwegianOkinawanOsageOttawaPaiutePakistaniPalestinianPanamanianParaguayanPennsylvania GermanPeruvianPimaPolishPortuguesePotawatomiPuebloPuerto RicanPuget Sound SalishRomanianRussianSalvadoranSamoanScandinavianScotch-IrishScottishSeminoleSenegaleseSerbianShoshoneSierra LeoneanSiouxSlavicSlovakSloveneSomaliSouth AfricanSouth AmericanSouth American IndianSoviet UnionSpaniardSpanishSpanish AmericanSpanish American IndianSri LankanSubsaharan AfricanSudaneseSwedishSwissSyrianTaiwaneseThaiTohono O'OdhamTonganTrinidadian and TobagonianTsimshianTurkishU.S. Virgin IslanderUgandanUkrainianUruguayanUteVenezuelanVietnameseWelshWest IndianYakamaYaquiYugoslavianYumanYup'ikZimbabwean
Immigration
NonimmigrantsImmigrantsAfghanistanAfricaAlbaniaArgentinaArmeniaAsiaAustraliaAustriaBahamasBangladeshBarbadosBelarusBelgiumBelizeBoliviaBosnia and HerzegovinaBrazilBulgariaBurma/MyanmarCabo VerdeCambodiaCameroonCanadaCaribbeanCentral AmericaChileChinaColombiaCongoCosta RicaCroatiaCubaCzechoslovakiaDenmarkDominicaDominican RepublicEastern AfricaEastern AsiaEastern EuropeEcuadorEgyptEl SalvadorEnglandEritreaEthiopiaEuropeFijiFranceGermanyGhanaGreeceGrenadaGuatemalaGuyanaHaitiHondurasHong KongHungaryIndiaIndonesiaIranIraqIrelandIsraelItalyJamaicaJapanJordanKazakhstanKenyaKoreaKuwaitLaosLatin AmericaLatviaLebanonLiberiaLithuaniaMalaysiaMexicoMicronesiaMiddle AfricaMoldovaMoroccoNepalNetherlandsNicaraguaNigeriaNorth AmericaNorth MacedoniaNorthern AfricaNorthern EuropeNorwayOceaniaPakistanPanamaPeruPhilippinesPolandPortugalRomaniaRussiaSaudi ArabiaScotlandSenegalSerbiaSierra LeoneSingaporeSomaliaSouth AfricaSouth AmericaSouth Central AsiaSouth Eastern AsiaSouthern EuropeSpainSri LankaSt. Vincent and the GrenadinesSudanSwedenSwitzerlandSyriaTaiwanThailandTrinidad and TobagoTurkeyUgandaUkraineUruguayUzbekistanVenezuelaVietnamWest IndiesWestern AfricaWestern AsiaWestern EuropeYemenZaireZimbabweAzores
Tlingit-Haida
Race
Ancestry
AfghanAfricanAlaska NativeAlaskan AthabascanAlbanianAleutAlsatianAmericanApacheArabArapahoArgentineanArmenianAssyrian/Chaldean/SyriacAustralianAustrianBahamianBangladeshiBarbadianBasqueBelgianBelizeanBermudanBhutaneseBlackfeetBolivianBrazilianBritishBritish West IndianBulgarianBurmeseCajunCambodianCanadianCape VerdeanCarpatho RusynCelticCentral AmericanCentral American IndianCherokeeCheyenneChickasawChileanChineseChippewaChoctawColombianColvilleComancheCosta RicanCreeCreekCroatianCrowCubanCypriotCzechCzechoslovakianDanishDelawareDominicanDutchDutch West IndianEastern EuropeanEgyptianEnglishEstonianEthiopianEuropeanFijianFilipinoFinnishFrenchFrench American IndianFrench CanadianGermanGerman RussianGhanaianGreekGuamanian/ChamorroGuatemalanGuyaneseHaitianHmongHonduranHopiHoumaHungarianIcelanderIndian (Asian)IndonesianInupiatIranianIraqiIrishIroquoisIsraeliItalianJamaicanJapaneseJordanianKenyanKiowaKoreanLaotianLatvianLebaneseLiberianLithuanianLumbeeLuxembourgerMacedonianMalaysianMalteseMarshalleseMenomineeMexicanMexican American IndianMongolianMoroccanNative HawaiianNavajoNepaleseNew ZealanderNicaraguanNigerianNorthern EuropeanNorwegianOkinawanOsageOttawaPaiutePakistaniPalestinianPanamanianParaguayanPennsylvania GermanPeruvianPimaPolishPortuguesePotawatomiPuebloPuerto RicanPuget Sound SalishRomanianRussianSalvadoranSamoanScandinavianScotch-IrishScottishSeminoleSenegaleseSerbianShoshoneSierra LeoneanSiouxSlavicSlovakSloveneSomaliSouth AfricanSouth AmericanSouth American IndianSoviet UnionSpaniardSpanishSpanish AmericanSpanish American IndianSri LankanSubsaharan AfricanSudaneseSwedishSwissSyrianTaiwaneseThaiTlingit-HaidaTohono O'OdhamTonganTrinidadian and TobagonianTsimshianTurkishU.S. Virgin IslanderUgandanUkrainianUruguayanUteVenezuelanVietnameseWelshWest IndianYakamaYaquiYugoslavianYumanYup'ikZimbabwean
Immigration
NonimmigrantsImmigrantsAfghanistanAfricaAlbaniaArgentinaArmeniaAsiaAustraliaAustriaBahamasBangladeshBarbadosBelarusBelgiumBelizeBoliviaBosnia and HerzegovinaBrazilBulgariaBurma/MyanmarCabo VerdeCambodiaCameroonCanadaCaribbeanCentral AmericaChileChinaColombiaCongoCosta RicaCroatiaCubaCzechoslovakiaDenmarkDominicaDominican RepublicEastern AfricaEastern AsiaEastern EuropeEcuadorEgyptEl SalvadorEnglandEritreaEthiopiaEuropeFijiFranceGermanyGhanaGreeceGrenadaGuatemalaGuyanaHaitiHondurasHong KongHungaryIndiaIndonesiaIranIraqIrelandIsraelItalyJamaicaJapanJordanKazakhstanKenyaKoreaKuwaitLaosLatin AmericaLatviaLebanonLiberiaLithuaniaMalaysiaMexicoMicronesiaMiddle AfricaMoldovaMoroccoNepalNetherlandsNicaraguaNigeriaNorth AmericaNorth MacedoniaNorthern AfricaNorthern EuropeNorwayOceaniaPakistanPanamaPeruPhilippinesPolandPortugalRomaniaRussiaSaudi ArabiaScotlandSenegalSerbiaSierra LeoneSingaporeSomaliaSouth AfricaSouth AmericaSouth Central AsiaSouth Eastern AsiaSouthern EuropeSpainSri LankaSt. Vincent and the GrenadinesSudanSwedenSwitzerlandSyriaTaiwanThailandTrinidad and TobagoTurkeyUgandaUkraineUruguayUzbekistanVenezuelaVietnamWest IndiesWestern AfricaWestern AsiaWestern EuropeYemenZaireZimbabweAzores
Receiving Food Stamps
Income
Poverty
Unemployment
Labor Participation
Family Structure
Vehicle Availability
Education Level
Disability

Receiving Food Stamps Comparison

Ecuadorians

Tlingit-Haida

Tragic
Average
14.9%
RECEIVING FOOD STAMPS
0.0/ 100
METRIC RATING
280th/ 347
METRIC RANK
11.6%
RECEIVING FOOD STAMPS
59.1/ 100
METRIC RATING
168th/ 347
METRIC RANK

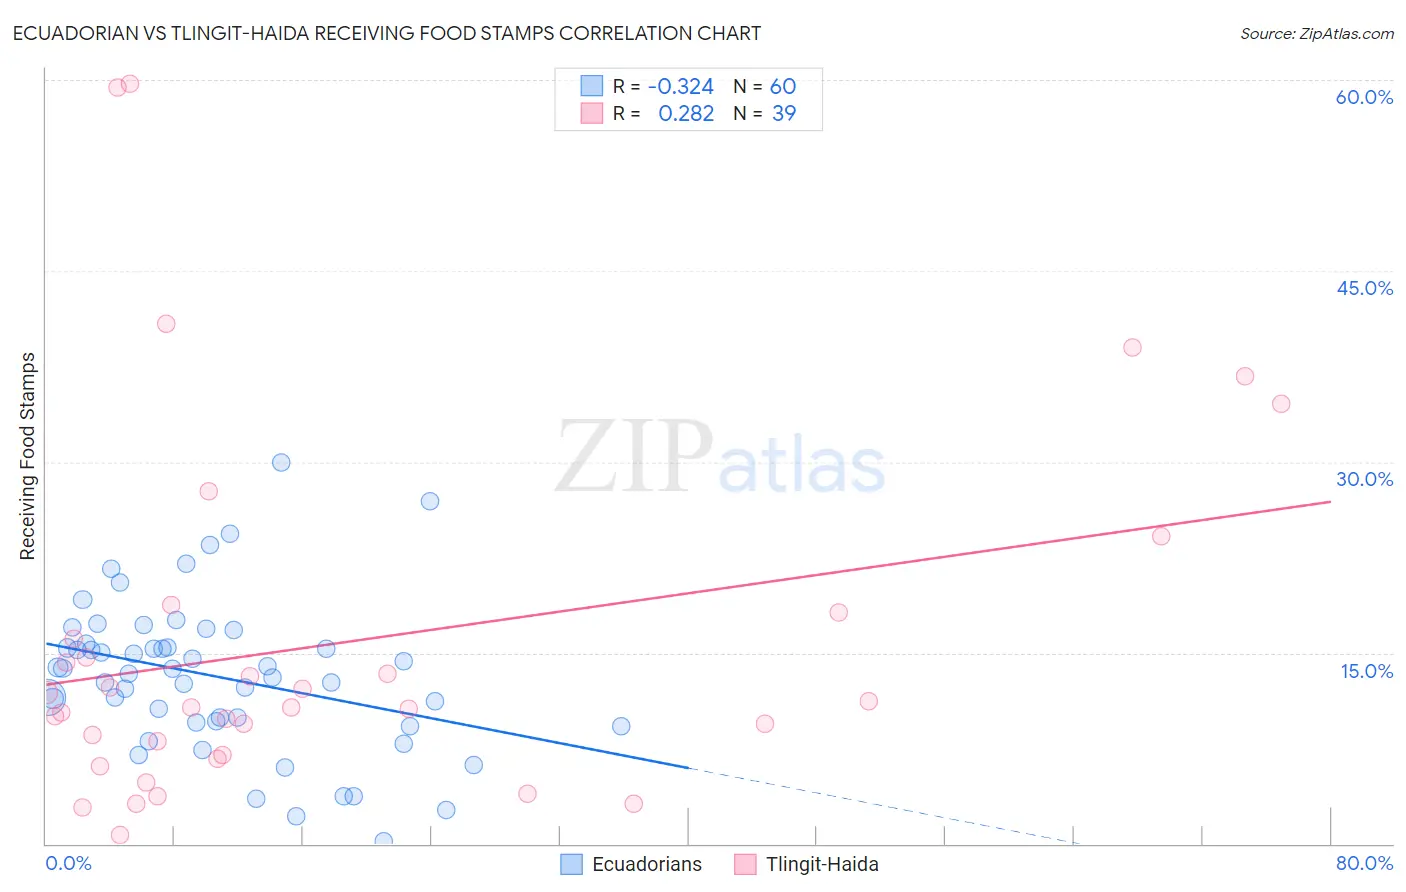
Ecuadorian vs Tlingit-Haida Receiving Food Stamps Correlation Chart

The statistical analysis conducted on geographies consisting of 317,062,012 people shows a mild negative correlation between the proportion of Ecuadorians and percentage of population receiving government assistance and/or food stamps in the United States with a correlation coefficient (R) of -0.324 and weighted average of 14.9%. Similarly, the statistical analysis conducted on geographies consisting of 60,831,023 people shows a weak positive correlation between the proportion of Tlingit-Haida and percentage of population receiving government assistance and/or food stamps in the United States with a correlation coefficient (R) of 0.282 and weighted average of 11.6%, a difference of 28.4%.
Ecuadorian vs Tlingit-Haida Receiving Food Stamps

Receiving Food Stamps Correlation Summary

MeasurementEcuadorianTlingit-Haida
Minimum0.20%0.70%
Maximum30.0%59.7%
Range29.8%59.0%
Mean13.1%15.8%
Median13.6%10.7%
Interquartile 25% (IQ1)9.6%7.0%
Interquartile 75% (IQ3)15.6%18.2%
Interquartile Range (IQR)6.0%11.2%
Standard Deviation (Sample)5.9%14.4%
Standard Deviation (Population)5.9%14.2%

Similar Demographics by Receiving Food Stamps

Demographics Similar to Ecuadorians by Receiving Food Stamps

In terms of receiving food stamps, the demographic groups most similar to Ecuadorians are Kiowa (14.9%, a difference of 0.050%), Belizean (14.8%, a difference of 0.32%), Spanish American Indian (14.9%, a difference of 0.32%), Seminole (14.8%, a difference of 0.45%), and Liberian (14.8%, a difference of 0.50%).
DemographicsRating | RankReceiving Food Stamps
Alaskan Athabascans
0.1
/100
|
#273
Tragic
14.7%
Immigrants | Western Africa
0.1
/100
|
#274
Tragic
14.7%
Ute
0.1
/100
|
#275
Tragic
14.7%
Liberians
0.1
/100
|
#276
Tragic
14.8%
Seminole
0.1
/100
|
#277
Tragic
14.8%
Belizeans
0.1
/100
|
#278
Tragic
14.8%
Kiowa
0.0
/100
|
#279
Tragic
14.9%
Ecuadorians
0.0
/100
|
#280
Tragic
14.9%
Spanish American Indians
0.0
/100
|
#281
Tragic
14.9%
Immigrants | Central America
0.0
/100
|
#282
Tragic
15.0%
Bangladeshis
0.0
/100
|
#283
Tragic
15.0%
Immigrants | Ecuador
0.0
/100
|
#284
Tragic
15.0%
Immigrants | Liberia
0.0
/100
|
#285
Tragic
15.1%
Africans
0.0
/100
|
#286
Tragic
15.1%
Immigrants | Mexico
0.0
/100
|
#287
Tragic
15.2%

Demographics Similar to Tlingit-Haida by Receiving Food Stamps

In terms of receiving food stamps, the demographic groups most similar to Tlingit-Haida are Immigrants from Eastern Africa (11.6%, a difference of 0.12%), Kenyan (11.6%, a difference of 0.16%), Costa Rican (11.6%, a difference of 0.18%), Immigrants from Western Asia (11.6%, a difference of 0.40%), and Immigrants from Belarus (11.5%, a difference of 0.54%).
DemographicsRating | RankReceiving Food Stamps
Pennsylvania Germans
68.4
/100
|
#161
Good
11.4%
Alsatians
68.0
/100
|
#162
Good
11.4%
Immigrants | Southern Europe
65.8
/100
|
#163
Good
11.5%
Immigrants | Chile
65.0
/100
|
#164
Good
11.5%
Arabs
64.7
/100
|
#165
Good
11.5%
Immigrants | Belarus
62.8
/100
|
#166
Good
11.5%
Kenyans
60.2
/100
|
#167
Good
11.6%
Tlingit-Haida
59.1
/100
|
#168
Average
11.6%
Immigrants | Eastern Africa
58.3
/100
|
#169
Average
11.6%
Costa Ricans
57.9
/100
|
#170
Average
11.6%
Immigrants | Western Asia
56.4
/100
|
#171
Average
11.6%
Guamanians/Chamorros
54.2
/100
|
#172
Average
11.7%
Immigrants | Syria
53.4
/100
|
#173
Average
11.7%
Immigrants | Eritrea
50.0
/100
|
#174
Average
11.7%
Osage
49.8
/100
|
#175
Average
11.7%