Bermudan vs English Receiving Food Stamps
COMPARE
Bermudan
English
Receiving Food Stamps
Receiving Food Stamps Comparison
Bermudans
English
13.0%
RECEIVING FOOD STAMPS
4.8/ 100
METRIC RATING
221st/ 347
METRIC RANK
9.8%
RECEIVING FOOD STAMPS
99.2/ 100
METRIC RATING
61st/ 347
METRIC RANK
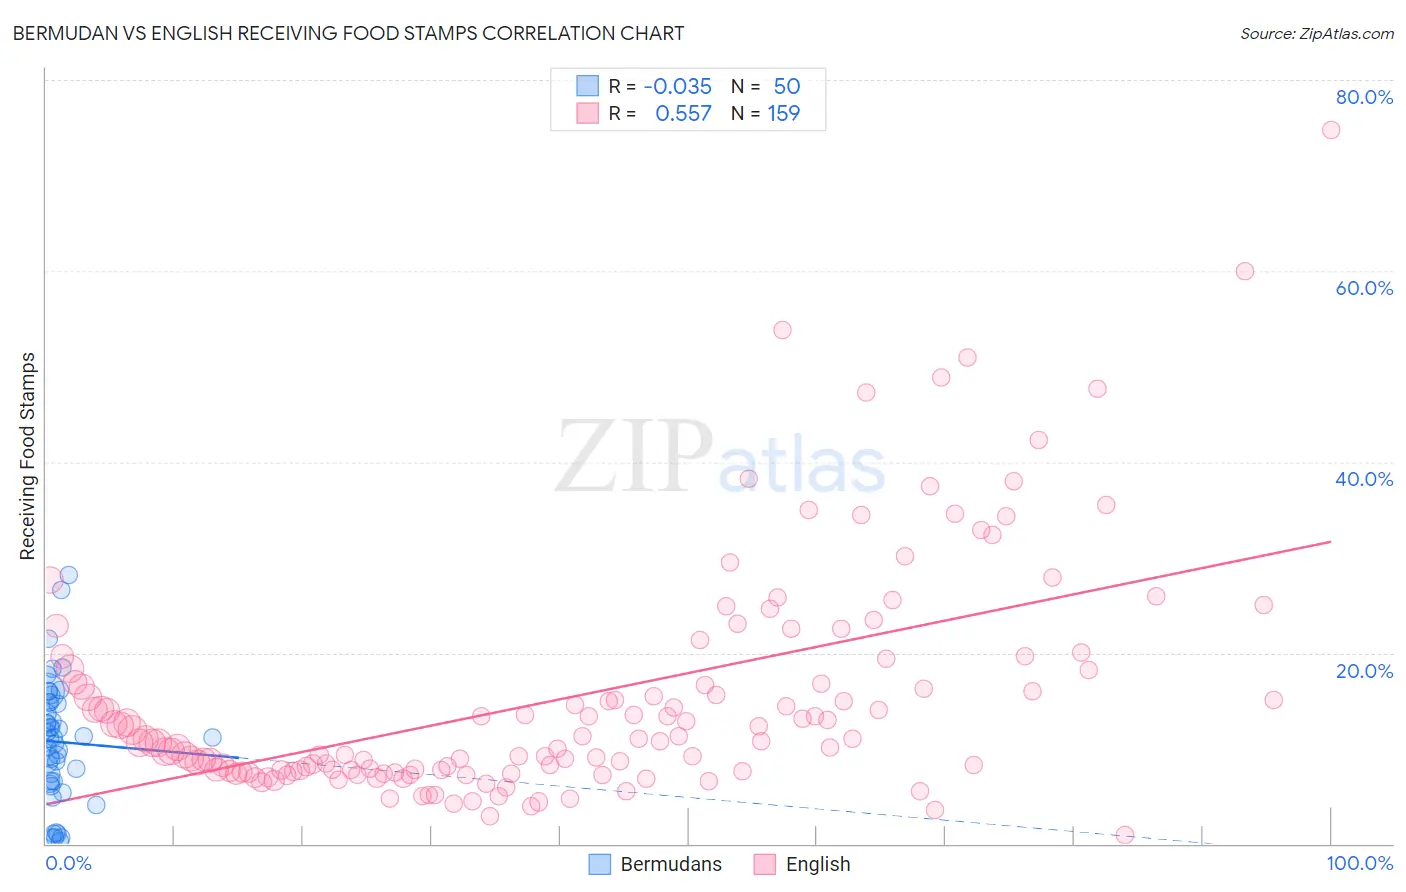
Bermudan vs English Receiving Food Stamps Correlation Chart
The statistical analysis conducted on geographies consisting of 55,651,694 people shows no correlation between the proportion of Bermudans and percentage of population receiving government assistance and/or food stamps in the United States with a correlation coefficient (R) of -0.035 and weighted average of 13.0%. Similarly, the statistical analysis conducted on geographies consisting of 575,562,331 people shows a substantial positive correlation between the proportion of English and percentage of population receiving government assistance and/or food stamps in the United States with a correlation coefficient (R) of 0.557 and weighted average of 9.8%, a difference of 32.9%.
Receiving Food Stamps Correlation Summary
| Measurement | Bermudan | English |
| Minimum | 0.20% | 0.90% |
| Maximum | 28.2% | 74.8% |
| Range | 28.0% | 73.9% |
| Mean | 10.7% | 15.3% |
| Median | 11.1% | 10.8% |
| Interquartile 25% (IQ1) | 6.6% | 7.6% |
| Interquartile 75% (IQ3) | 14.8% | 18.2% |
| Interquartile Range (IQR) | 8.2% | 10.6% |
| Standard Deviation (Sample) | 6.3% | 12.2% |
| Standard Deviation (Population) | 6.3% | 12.1% |
Similar Demographics by Receiving Food Stamps
Demographics Similar to Bermudans by Receiving Food Stamps
In terms of receiving food stamps, the demographic groups most similar to Bermudans are Immigrants (13.0%, a difference of 0.26%), Immigrants from Albania (13.0%, a difference of 0.30%), Immigrants from Colombia (12.9%, a difference of 0.32%), Immigrants from Middle Africa (12.9%, a difference of 0.36%), and Hawaiian (12.9%, a difference of 0.37%).
| Demographics | Rating | Rank | Receiving Food Stamps |
| Immigrants | Africa | 7.6 /100 | #214 | Tragic 12.8% |
| Native Hawaiians | 6.7 /100 | #215 | Tragic 12.8% |
| Immigrants | South America | 6.5 /100 | #216 | Tragic 12.8% |
| Immigrants | Burma/Myanmar | 6.0 /100 | #217 | Tragic 12.9% |
| Hawaiians | 5.4 /100 | #218 | Tragic 12.9% |
| Immigrants | Middle Africa | 5.4 /100 | #219 | Tragic 12.9% |
| Immigrants | Colombia | 5.3 /100 | #220 | Tragic 12.9% |
| Bermudans | 4.8 /100 | #221 | Tragic 13.0% |
| Immigrants | Immigrants | 4.4 /100 | #222 | Tragic 13.0% |
| Immigrants | Albania | 4.4 /100 | #223 | Tragic 13.0% |
| Immigrants | Armenia | 4.3 /100 | #224 | Tragic 13.0% |
| Fijians | 4.3 /100 | #225 | Tragic 13.0% |
| Chickasaw | 3.6 /100 | #226 | Tragic 13.1% |
| Nigerians | 3.5 /100 | #227 | Tragic 13.1% |
| Panamanians | 3.5 /100 | #228 | Tragic 13.1% |
Demographics Similar to English by Receiving Food Stamps
In terms of receiving food stamps, the demographic groups most similar to English are Immigrants from Bulgaria (9.8%, a difference of 0.080%), Chinese (9.8%, a difference of 0.11%), German (9.7%, a difference of 0.14%), Immigrants from North America (9.8%, a difference of 0.19%), and British (9.7%, a difference of 0.24%).
| Demographics | Rating | Rank | Receiving Food Stamps |
| Swiss | 99.3 /100 | #54 | Exceptional 9.7% |
| Immigrants | Switzerland | 99.3 /100 | #55 | Exceptional 9.7% |
| Immigrants | Canada | 99.3 /100 | #56 | Exceptional 9.7% |
| Greeks | 99.3 /100 | #57 | Exceptional 9.7% |
| Scandinavians | 99.2 /100 | #58 | Exceptional 9.7% |
| British | 99.2 /100 | #59 | Exceptional 9.7% |
| Germans | 99.2 /100 | #60 | Exceptional 9.7% |
| English | 99.2 /100 | #61 | Exceptional 9.8% |
| Immigrants | Bulgaria | 99.2 /100 | #62 | Exceptional 9.8% |
| Chinese | 99.2 /100 | #63 | Exceptional 9.8% |
| Immigrants | North America | 99.2 /100 | #64 | Exceptional 9.8% |
| Immigrants | Turkey | 99.1 /100 | #65 | Exceptional 9.8% |
| Slovenes | 99.1 /100 | #66 | Exceptional 9.8% |
| Immigrants | Indonesia | 99.0 /100 | #67 | Exceptional 9.8% |
| Northern Europeans | 99.0 /100 | #68 | Exceptional 9.8% |