Scottish vs Japanese Child Poverty Under the Age of 16
COMPARE
Scottish
Japanese
Child Poverty Under the Age of 16
Child Poverty Under the Age of 16 Comparison
Scottish
Japanese
15.0%
CHILD POVERTY UNDER THE AGE OF 16
92.3/ 100
METRIC RATING
119th/ 347
METRIC RANK
17.7%
CHILD POVERTY UNDER THE AGE OF 16
4.7/ 100
METRIC RATING
219th/ 347
METRIC RANK
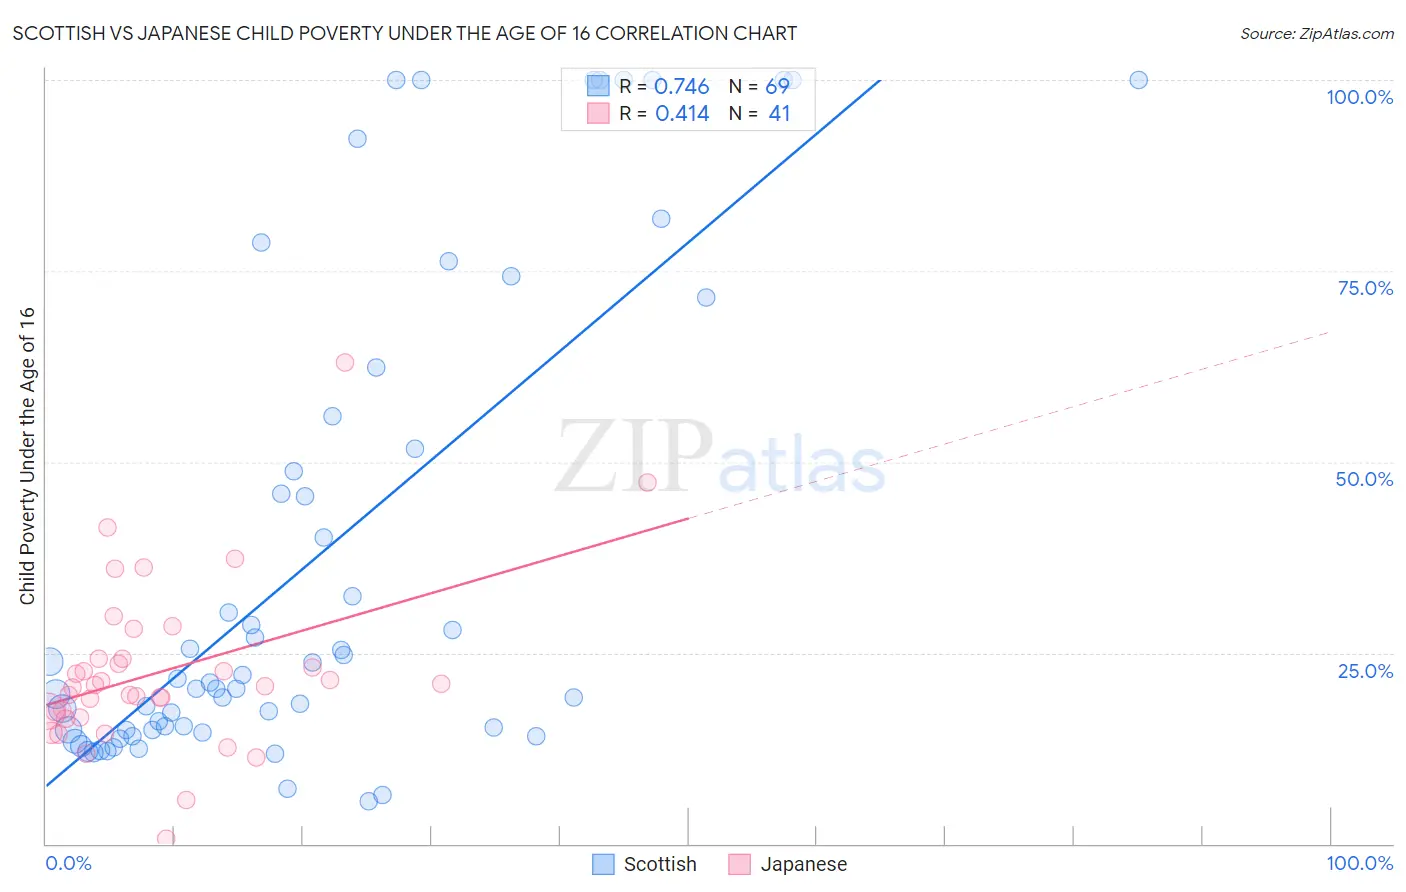
Scottish vs Japanese Child Poverty Under the Age of 16 Correlation Chart
The statistical analysis conducted on geographies consisting of 554,294,508 people shows a strong positive correlation between the proportion of Scottish and poverty level among children under the age of 16 in the United States with a correlation coefficient (R) of 0.746 and weighted average of 15.0%. Similarly, the statistical analysis conducted on geographies consisting of 248,294,497 people shows a moderate positive correlation between the proportion of Japanese and poverty level among children under the age of 16 in the United States with a correlation coefficient (R) of 0.414 and weighted average of 17.7%, a difference of 17.8%.
Child Poverty Under the Age of 16 Correlation Summary
| Measurement | Scottish | Japanese |
| Minimum | 5.6% | 0.73% |
| Maximum | 100.0% | 63.1% |
| Range | 94.4% | 62.3% |
| Mean | 37.1% | 22.5% |
| Median | 21.1% | 20.6% |
| Interquartile 25% (IQ1) | 14.9% | 16.9% |
| Interquartile 75% (IQ3) | 53.8% | 24.2% |
| Interquartile Range (IQR) | 38.9% | 7.3% |
| Standard Deviation (Sample) | 31.5% | 11.0% |
| Standard Deviation (Population) | 31.2% | 10.9% |
Similar Demographics by Child Poverty Under the Age of 16
Demographics Similar to Scottish by Child Poverty Under the Age of 16
In terms of child poverty under the age of 16, the demographic groups most similar to Scottish are South African (15.0%, a difference of 0.090%), Immigrants from Zimbabwe (15.0%, a difference of 0.090%), Immigrants from Malaysia (15.0%, a difference of 0.15%), Immigrants from Norway (15.0%, a difference of 0.21%), and Pakistani (15.0%, a difference of 0.29%).
| Demographics | Rating | Rank | Child Poverty Under the Age of 16 |
| Irish | 93.4 /100 | #112 | Exceptional 14.9% |
| Belgians | 93.3 /100 | #113 | Exceptional 14.9% |
| Sri Lankans | 93.2 /100 | #114 | Exceptional 14.9% |
| Immigrants | Ukraine | 93.1 /100 | #115 | Exceptional 14.9% |
| Carpatho Rusyns | 93.1 /100 | #116 | Exceptional 14.9% |
| Immigrants | Norway | 92.8 /100 | #117 | Exceptional 15.0% |
| Immigrants | Malaysia | 92.6 /100 | #118 | Exceptional 15.0% |
| Scottish | 92.3 /100 | #119 | Exceptional 15.0% |
| South Africans | 92.1 /100 | #120 | Exceptional 15.0% |
| Immigrants | Zimbabwe | 92.1 /100 | #121 | Exceptional 15.0% |
| Pakistanis | 91.7 /100 | #122 | Exceptional 15.0% |
| Immigrants | Brazil | 91.1 /100 | #123 | Exceptional 15.1% |
| Czechoslovakians | 91.0 /100 | #124 | Exceptional 15.1% |
| Palestinians | 90.9 /100 | #125 | Exceptional 15.1% |
| Portuguese | 90.6 /100 | #126 | Exceptional 15.1% |
Demographics Similar to Japanese by Child Poverty Under the Age of 16
In terms of child poverty under the age of 16, the demographic groups most similar to Japanese are Moroccan (17.6%, a difference of 0.36%), Immigrants from Eastern Africa (17.6%, a difference of 0.37%), Immigrants from Panama (17.7%, a difference of 0.40%), Sierra Leonean (17.6%, a difference of 0.56%), and Malaysian (17.5%, a difference of 0.67%).
| Demographics | Rating | Rank | Child Poverty Under the Age of 16 |
| Immigrants | Immigrants | 6.5 /100 | #212 | Tragic 17.5% |
| Immigrants | Azores | 6.2 /100 | #213 | Tragic 17.5% |
| Iraqis | 5.9 /100 | #214 | Tragic 17.5% |
| Malaysians | 5.9 /100 | #215 | Tragic 17.5% |
| Sierra Leoneans | 5.7 /100 | #216 | Tragic 17.6% |
| Immigrants | Eastern Africa | 5.3 /100 | #217 | Tragic 17.6% |
| Moroccans | 5.3 /100 | #218 | Tragic 17.6% |
| Japanese | 4.7 /100 | #219 | Tragic 17.7% |
| Immigrants | Panama | 4.1 /100 | #220 | Tragic 17.7% |
| Cubans | 3.7 /100 | #221 | Tragic 17.8% |
| Immigrants | Armenia | 3.6 /100 | #222 | Tragic 17.8% |
| Immigrants | Cambodia | 3.3 /100 | #223 | Tragic 17.8% |
| Osage | 3.1 /100 | #224 | Tragic 17.9% |
| Immigrants | Nonimmigrants | 2.7 /100 | #225 | Tragic 17.9% |
| Bermudans | 2.6 /100 | #226 | Tragic 18.0% |