African vs Tlingit-Haida Child Poverty Under the Age of 16
COMPARE
African
Tlingit-Haida
Child Poverty Under the Age of 16
Child Poverty Under the Age of 16 Comparison
Africans
Tlingit-Haida
21.7%
CHILD POVERTY UNDER THE AGE OF 16
0.0/ 100
METRIC RATING
316th/ 347
METRIC RANK
14.9%
CHILD POVERTY UNDER THE AGE OF 16
94.1/ 100
METRIC RATING
109th/ 347
METRIC RANK
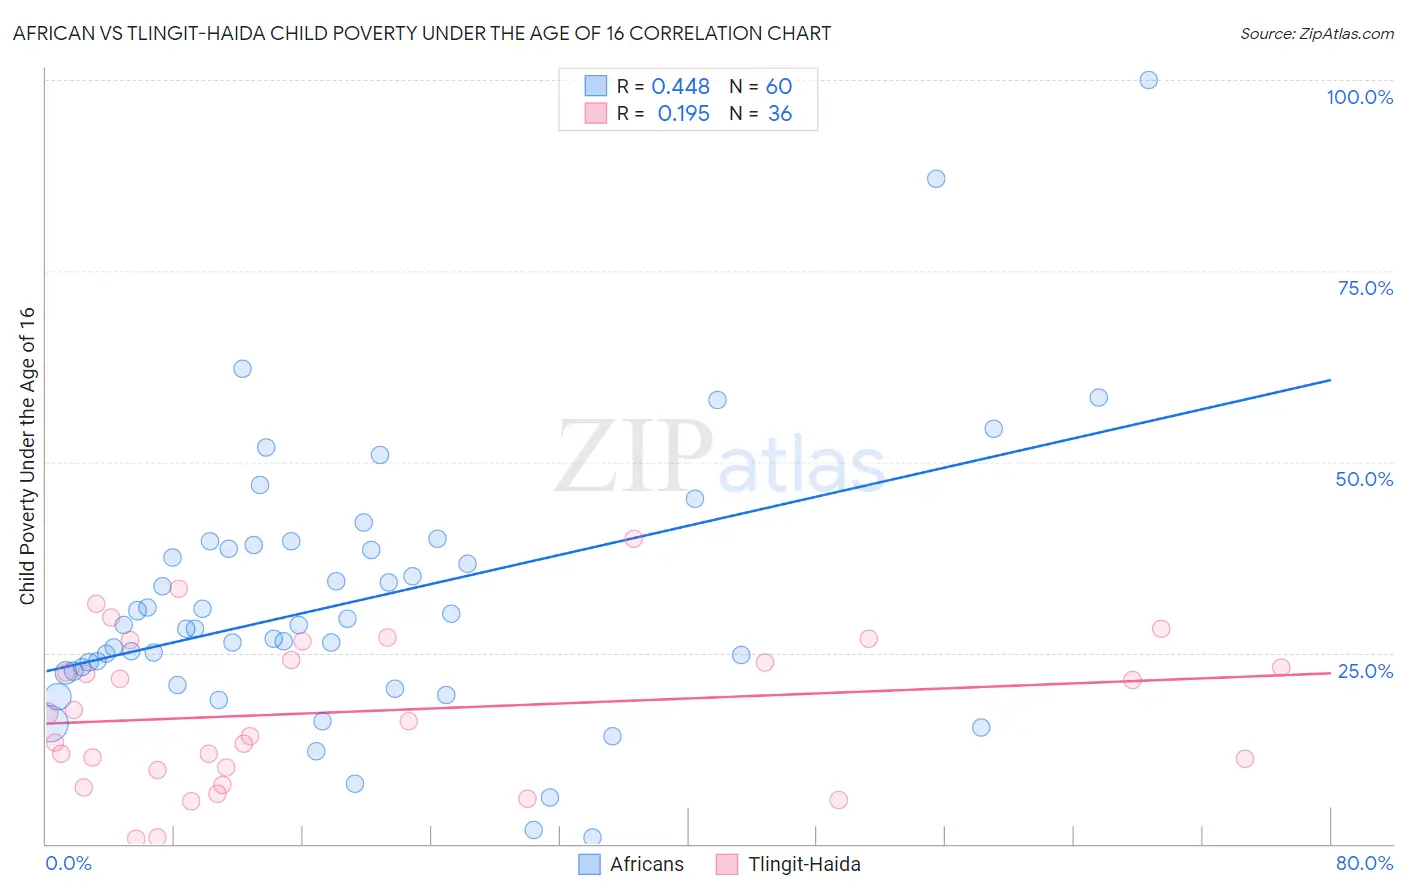
African vs Tlingit-Haida Child Poverty Under the Age of 16 Correlation Chart
The statistical analysis conducted on geographies consisting of 466,270,452 people shows a moderate positive correlation between the proportion of Africans and poverty level among children under the age of 16 in the United States with a correlation coefficient (R) of 0.448 and weighted average of 21.7%. Similarly, the statistical analysis conducted on geographies consisting of 60,748,719 people shows a poor positive correlation between the proportion of Tlingit-Haida and poverty level among children under the age of 16 in the United States with a correlation coefficient (R) of 0.195 and weighted average of 14.9%, a difference of 46.1%.
Child Poverty Under the Age of 16 Correlation Summary
| Measurement | African | Tlingit-Haida |
| Minimum | 0.88% | 0.72% |
| Maximum | 100.0% | 40.0% |
| Range | 99.1% | 39.3% |
| Mean | 31.8% | 17.4% |
| Median | 28.4% | 16.5% |
| Interquartile 25% (IQ1) | 22.5% | 9.8% |
| Interquartile 75% (IQ3) | 38.9% | 25.3% |
| Interquartile Range (IQR) | 16.5% | 15.5% |
| Standard Deviation (Sample) | 17.6% | 9.8% |
| Standard Deviation (Population) | 17.5% | 9.6% |
Similar Demographics by Child Poverty Under the Age of 16
Demographics Similar to Africans by Child Poverty Under the Age of 16
In terms of child poverty under the age of 16, the demographic groups most similar to Africans are Immigrants from Guatemala (21.6%, a difference of 0.42%), Immigrants from Somalia (21.6%, a difference of 0.56%), Creek (21.5%, a difference of 0.76%), Immigrants from Dominica (21.9%, a difference of 0.77%), and Ute (21.5%, a difference of 0.79%).
| Demographics | Rating | Rank | Child Poverty Under the Age of 16 |
| Immigrants | Mexico | 0.0 /100 | #309 | Tragic 21.5% |
| Bahamians | 0.0 /100 | #310 | Tragic 21.5% |
| Dutch West Indians | 0.0 /100 | #311 | Tragic 21.5% |
| Ute | 0.0 /100 | #312 | Tragic 21.5% |
| Creek | 0.0 /100 | #313 | Tragic 21.5% |
| Immigrants | Somalia | 0.0 /100 | #314 | Tragic 21.6% |
| Immigrants | Guatemala | 0.0 /100 | #315 | Tragic 21.6% |
| Africans | 0.0 /100 | #316 | Tragic 21.7% |
| Immigrants | Dominica | 0.0 /100 | #317 | Tragic 21.9% |
| U.S. Virgin Islanders | 0.0 /100 | #318 | Tragic 22.0% |
| Yakama | 0.0 /100 | #319 | Tragic 22.1% |
| Cajuns | 0.0 /100 | #320 | Tragic 22.1% |
| Kiowa | 0.0 /100 | #321 | Tragic 22.2% |
| Hondurans | 0.0 /100 | #322 | Tragic 22.2% |
| Paiute | 0.0 /100 | #323 | Tragic 22.4% |
Demographics Similar to Tlingit-Haida by Child Poverty Under the Age of 16
In terms of child poverty under the age of 16, the demographic groups most similar to Tlingit-Haida are Jordanian (14.8%, a difference of 0.070%), Chilean (14.8%, a difference of 0.16%), Serbian (14.8%, a difference of 0.22%), English (14.9%, a difference of 0.34%), and Basque (14.8%, a difference of 0.35%).
| Demographics | Rating | Rank | Child Poverty Under the Age of 16 |
| Romanians | 95.0 /100 | #102 | Exceptional 14.8% |
| Immigrants | Egypt | 94.9 /100 | #103 | Exceptional 14.8% |
| Immigrants | England | 94.8 /100 | #104 | Exceptional 14.8% |
| Basques | 94.7 /100 | #105 | Exceptional 14.8% |
| Serbians | 94.5 /100 | #106 | Exceptional 14.8% |
| Chileans | 94.4 /100 | #107 | Exceptional 14.8% |
| Jordanians | 94.2 /100 | #108 | Exceptional 14.8% |
| Tlingit-Haida | 94.1 /100 | #109 | Exceptional 14.9% |
| English | 93.5 /100 | #110 | Exceptional 14.9% |
| Immigrants | Denmark | 93.5 /100 | #111 | Exceptional 14.9% |
| Irish | 93.4 /100 | #112 | Exceptional 14.9% |
| Belgians | 93.3 /100 | #113 | Exceptional 14.9% |
| Sri Lankans | 93.2 /100 | #114 | Exceptional 14.9% |
| Immigrants | Ukraine | 93.1 /100 | #115 | Exceptional 14.9% |
| Carpatho Rusyns | 93.1 /100 | #116 | Exceptional 14.9% |