Scottish vs Japanese Disability Age Over 75
COMPARE
Scottish
Japanese
Disability Age Over 75
Disability Age Over 75 Comparison
Scottish
Japanese
46.7%
DISABILITY AGE OVER 75
90.5/ 100
METRIC RATING
131st/ 347
METRIC RANK
50.2%
DISABILITY AGE OVER 75
0.0/ 100
METRIC RATING
303rd/ 347
METRIC RANK
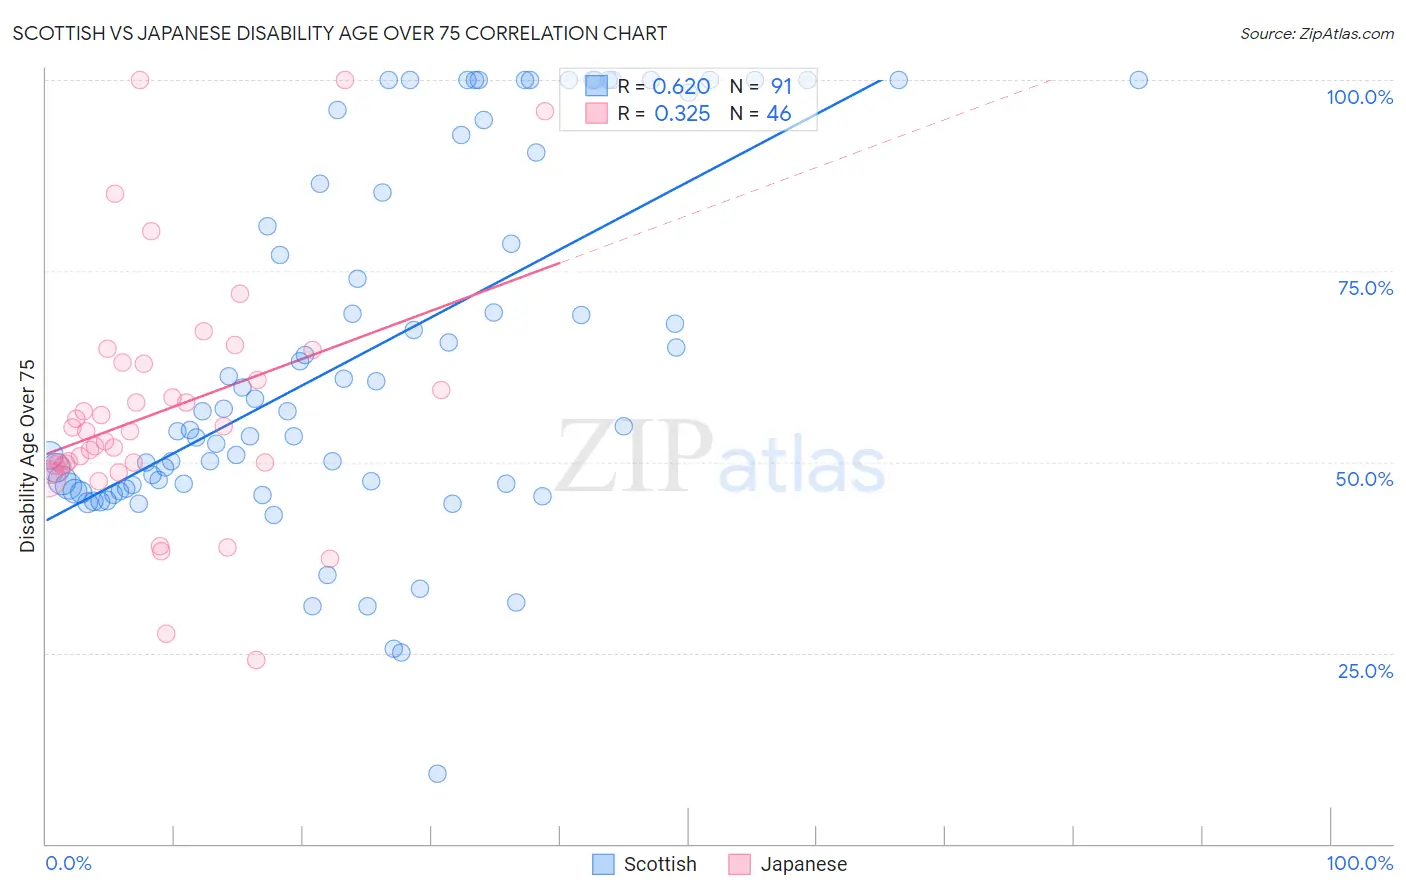
Scottish vs Japanese Disability Age Over 75 Correlation Chart
The statistical analysis conducted on geographies consisting of 565,035,071 people shows a significant positive correlation between the proportion of Scottish and percentage of population with a disability over the age of 75 in the United States with a correlation coefficient (R) of 0.620 and weighted average of 46.7%. Similarly, the statistical analysis conducted on geographies consisting of 248,861,887 people shows a mild positive correlation between the proportion of Japanese and percentage of population with a disability over the age of 75 in the United States with a correlation coefficient (R) of 0.325 and weighted average of 50.2%, a difference of 7.5%.
Disability Age Over 75 Correlation Summary
| Measurement | Scottish | Japanese |
| Minimum | 9.1% | 24.0% |
| Maximum | 100.0% | 100.0% |
| Range | 90.9% | 76.0% |
| Mean | 64.1% | 56.6% |
| Median | 56.7% | 54.0% |
| Interquartile 25% (IQ1) | 46.8% | 49.6% |
| Interquartile 75% (IQ3) | 90.5% | 62.8% |
| Interquartile Range (IQR) | 43.6% | 13.3% |
| Standard Deviation (Sample) | 23.7% | 15.9% |
| Standard Deviation (Population) | 23.6% | 15.7% |
Similar Demographics by Disability Age Over 75
Demographics Similar to Scottish by Disability Age Over 75
In terms of disability age over 75, the demographic groups most similar to Scottish are Immigrants from Northern Africa (46.7%, a difference of 0.010%), Immigrants from Germany (46.7%, a difference of 0.020%), Icelander (46.7%, a difference of 0.030%), South American (46.8%, a difference of 0.030%), and Syrian (46.7%, a difference of 0.040%).
| Demographics | Rating | Rank | Disability Age Over 75 |
| Immigrants | South America | 91.8 /100 | #124 | Exceptional 46.7% |
| Colombians | 91.3 /100 | #125 | Exceptional 46.7% |
| Europeans | 91.2 /100 | #126 | Exceptional 46.7% |
| Syrians | 91.1 /100 | #127 | Exceptional 46.7% |
| Icelanders | 90.9 /100 | #128 | Exceptional 46.7% |
| Immigrants | Germany | 90.8 /100 | #129 | Exceptional 46.7% |
| Immigrants | Northern Africa | 90.7 /100 | #130 | Exceptional 46.7% |
| Scottish | 90.5 /100 | #131 | Exceptional 46.7% |
| South Americans | 90.0 /100 | #132 | Excellent 46.8% |
| English | 89.4 /100 | #133 | Excellent 46.8% |
| Immigrants | Ethiopia | 89.1 /100 | #134 | Excellent 46.8% |
| Ethiopians | 88.9 /100 | #135 | Excellent 46.8% |
| Immigrants | Venezuela | 88.6 /100 | #136 | Excellent 46.8% |
| Immigrants | Uganda | 88.5 /100 | #137 | Excellent 46.8% |
| Immigrants | Bosnia and Herzegovina | 88.5 /100 | #138 | Excellent 46.8% |
Demographics Similar to Japanese by Disability Age Over 75
In terms of disability age over 75, the demographic groups most similar to Japanese are Cherokee (50.2%, a difference of 0.010%), Immigrants from Dominican Republic (50.3%, a difference of 0.11%), Dominican (50.2%, a difference of 0.17%), Cape Verdean (50.1%, a difference of 0.23%), and Immigrants from Micronesia (50.1%, a difference of 0.26%).
| Demographics | Rating | Rank | Disability Age Over 75 |
| Mexican American Indians | 0.0 /100 | #296 | Tragic 50.0% |
| Armenians | 0.0 /100 | #297 | Tragic 50.0% |
| Marshallese | 0.0 /100 | #298 | Tragic 50.1% |
| Immigrants | Micronesia | 0.0 /100 | #299 | Tragic 50.1% |
| Cape Verdeans | 0.0 /100 | #300 | Tragic 50.1% |
| Dominicans | 0.0 /100 | #301 | Tragic 50.2% |
| Cherokee | 0.0 /100 | #302 | Tragic 50.2% |
| Japanese | 0.0 /100 | #303 | Tragic 50.2% |
| Immigrants | Dominican Republic | 0.0 /100 | #304 | Tragic 50.3% |
| Central American Indians | 0.0 /100 | #305 | Tragic 50.5% |
| Immigrants | Central America | 0.0 /100 | #306 | Tragic 50.5% |
| Immigrants | Fiji | 0.0 /100 | #307 | Tragic 50.6% |
| Hispanics or Latinos | 0.0 /100 | #308 | Tragic 50.6% |
| Aleuts | 0.0 /100 | #309 | Tragic 50.6% |
| Tlingit-Haida | 0.0 /100 | #310 | Tragic 50.6% |