Senegalese vs Japanese Child Poverty Under the Age of 16
COMPARE
Senegalese
Japanese
Child Poverty Under the Age of 16
Child Poverty Under the Age of 16 Comparison
Senegalese
Japanese
20.4%
CHILD POVERTY UNDER THE AGE OF 16
0.0/ 100
METRIC RATING
289th/ 347
METRIC RANK
17.7%
CHILD POVERTY UNDER THE AGE OF 16
4.7/ 100
METRIC RATING
219th/ 347
METRIC RANK
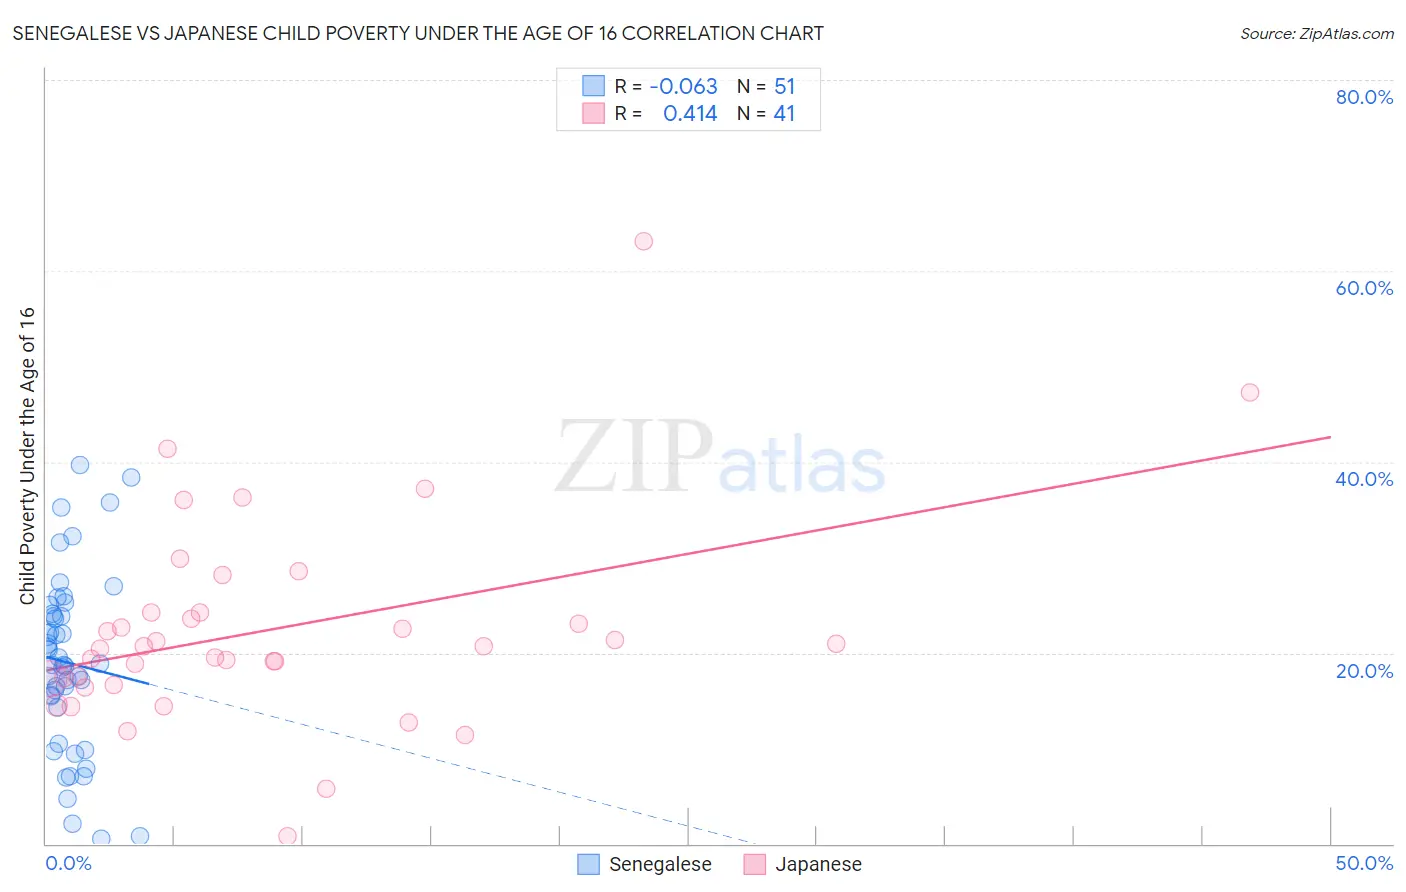
Senegalese vs Japanese Child Poverty Under the Age of 16 Correlation Chart
The statistical analysis conducted on geographies consisting of 78,012,841 people shows a slight negative correlation between the proportion of Senegalese and poverty level among children under the age of 16 in the United States with a correlation coefficient (R) of -0.063 and weighted average of 20.4%. Similarly, the statistical analysis conducted on geographies consisting of 248,294,497 people shows a moderate positive correlation between the proportion of Japanese and poverty level among children under the age of 16 in the United States with a correlation coefficient (R) of 0.414 and weighted average of 17.7%, a difference of 15.2%.
Child Poverty Under the Age of 16 Correlation Summary
| Measurement | Senegalese | Japanese |
| Minimum | 0.47% | 0.73% |
| Maximum | 39.6% | 63.1% |
| Range | 39.2% | 62.3% |
| Mean | 19.0% | 22.5% |
| Median | 18.7% | 20.6% |
| Interquartile 25% (IQ1) | 14.3% | 16.9% |
| Interquartile 75% (IQ3) | 24.1% | 24.2% |
| Interquartile Range (IQR) | 9.8% | 7.3% |
| Standard Deviation (Sample) | 9.2% | 11.0% |
| Standard Deviation (Population) | 9.1% | 10.9% |
Similar Demographics by Child Poverty Under the Age of 16
Demographics Similar to Senegalese by Child Poverty Under the Age of 16
In terms of child poverty under the age of 16, the demographic groups most similar to Senegalese are Yaqui (20.4%, a difference of 0.040%), Immigrants from Belize (20.3%, a difference of 0.24%), Chippewa (20.5%, a difference of 0.78%), Blackfeet (20.2%, a difference of 0.83%), and Immigrants from Latin America (20.5%, a difference of 0.83%).
| Demographics | Rating | Rank | Child Poverty Under the Age of 16 |
| Barbadians | 0.0 /100 | #282 | Tragic 20.0% |
| Immigrants | Zaire | 0.0 /100 | #283 | Tragic 20.1% |
| West Indians | 0.0 /100 | #284 | Tragic 20.1% |
| Immigrants | St. Vincent and the Grenadines | 0.0 /100 | #285 | Tragic 20.1% |
| Immigrants | West Indies | 0.0 /100 | #286 | Tragic 20.2% |
| Blackfeet | 0.0 /100 | #287 | Tragic 20.2% |
| Immigrants | Belize | 0.0 /100 | #288 | Tragic 20.3% |
| Senegalese | 0.0 /100 | #289 | Tragic 20.4% |
| Yaqui | 0.0 /100 | #290 | Tragic 20.4% |
| Chippewa | 0.0 /100 | #291 | Tragic 20.5% |
| Immigrants | Latin America | 0.0 /100 | #292 | Tragic 20.5% |
| Immigrants | Senegal | 0.0 /100 | #293 | Tragic 20.6% |
| Haitians | 0.0 /100 | #294 | Tragic 20.7% |
| Mexicans | 0.0 /100 | #295 | Tragic 20.7% |
| Immigrants | Caribbean | 0.0 /100 | #296 | Tragic 20.8% |
Demographics Similar to Japanese by Child Poverty Under the Age of 16
In terms of child poverty under the age of 16, the demographic groups most similar to Japanese are Moroccan (17.6%, a difference of 0.36%), Immigrants from Eastern Africa (17.6%, a difference of 0.37%), Immigrants from Panama (17.7%, a difference of 0.40%), Sierra Leonean (17.6%, a difference of 0.56%), and Malaysian (17.5%, a difference of 0.67%).
| Demographics | Rating | Rank | Child Poverty Under the Age of 16 |
| Immigrants | Immigrants | 6.5 /100 | #212 | Tragic 17.5% |
| Immigrants | Azores | 6.2 /100 | #213 | Tragic 17.5% |
| Iraqis | 5.9 /100 | #214 | Tragic 17.5% |
| Malaysians | 5.9 /100 | #215 | Tragic 17.5% |
| Sierra Leoneans | 5.7 /100 | #216 | Tragic 17.6% |
| Immigrants | Eastern Africa | 5.3 /100 | #217 | Tragic 17.6% |
| Moroccans | 5.3 /100 | #218 | Tragic 17.6% |
| Japanese | 4.7 /100 | #219 | Tragic 17.7% |
| Immigrants | Panama | 4.1 /100 | #220 | Tragic 17.7% |
| Cubans | 3.7 /100 | #221 | Tragic 17.8% |
| Immigrants | Armenia | 3.6 /100 | #222 | Tragic 17.8% |
| Immigrants | Cambodia | 3.3 /100 | #223 | Tragic 17.8% |
| Osage | 3.1 /100 | #224 | Tragic 17.9% |
| Immigrants | Nonimmigrants | 2.7 /100 | #225 | Tragic 17.9% |
| Bermudans | 2.6 /100 | #226 | Tragic 18.0% |