Immigrants from Sierra Leone vs Japanese Child Poverty Under the Age of 16
COMPARE
Immigrants from Sierra Leone
Japanese
Child Poverty Under the Age of 16
Child Poverty Under the Age of 16 Comparison
Immigrants from Sierra Leone
Japanese
17.1%
CHILD POVERTY UNDER THE AGE OF 16
14.2/ 100
METRIC RATING
203rd/ 347
METRIC RANK
17.7%
CHILD POVERTY UNDER THE AGE OF 16
4.7/ 100
METRIC RATING
219th/ 347
METRIC RANK
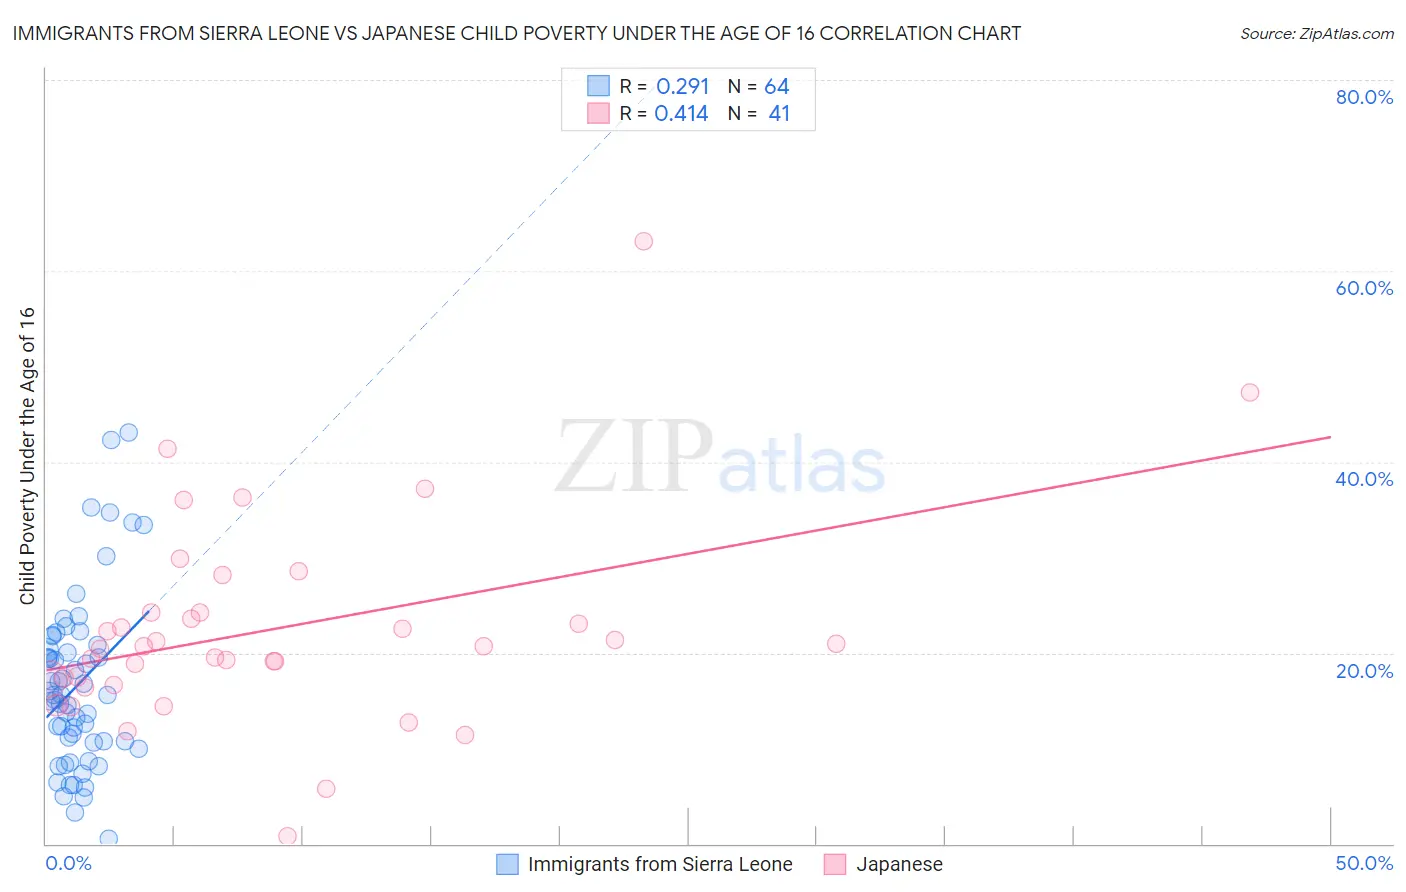
Immigrants from Sierra Leone vs Japanese Child Poverty Under the Age of 16 Correlation Chart
The statistical analysis conducted on geographies consisting of 101,506,912 people shows a weak positive correlation between the proportion of Immigrants from Sierra Leone and poverty level among children under the age of 16 in the United States with a correlation coefficient (R) of 0.291 and weighted average of 17.1%. Similarly, the statistical analysis conducted on geographies consisting of 248,294,497 people shows a moderate positive correlation between the proportion of Japanese and poverty level among children under the age of 16 in the United States with a correlation coefficient (R) of 0.414 and weighted average of 17.7%, a difference of 3.5%.
Child Poverty Under the Age of 16 Correlation Summary
| Measurement | Immigrants from Sierra Leone | Japanese |
| Minimum | 0.58% | 0.73% |
| Maximum | 43.1% | 63.1% |
| Range | 42.6% | 62.3% |
| Mean | 16.6% | 22.5% |
| Median | 15.5% | 20.6% |
| Interquartile 25% (IQ1) | 10.7% | 16.9% |
| Interquartile 75% (IQ3) | 20.5% | 24.2% |
| Interquartile Range (IQR) | 9.8% | 7.3% |
| Standard Deviation (Sample) | 9.0% | 11.0% |
| Standard Deviation (Population) | 9.0% | 10.9% |
Demographics Similar to Immigrants from Sierra Leone and Japanese by Child Poverty Under the Age of 16
In terms of child poverty under the age of 16, the demographic groups most similar to Immigrants from Sierra Leone are Ugandan (17.1%, a difference of 0.020%), Hmong (17.1%, a difference of 0.060%), Aleut (17.1%, a difference of 0.070%), Immigrants from Uzbekistan (17.1%, a difference of 0.10%), and Alaska Native (17.2%, a difference of 0.61%). Similarly, the demographic groups most similar to Japanese are Moroccan (17.6%, a difference of 0.36%), Immigrants from Eastern Africa (17.6%, a difference of 0.37%), Immigrants from Panama (17.7%, a difference of 0.40%), Sierra Leonean (17.6%, a difference of 0.56%), and Malaysian (17.5%, a difference of 0.67%).
| Demographics | Rating | Rank | Child Poverty Under the Age of 16 |
| Immigrants | Uzbekistan | 14.7 /100 | #201 | Poor 17.1% |
| Ugandans | 14.3 /100 | #202 | Poor 17.1% |
| Immigrants | Sierra Leone | 14.2 /100 | #203 | Poor 17.1% |
| Hmong | 14.0 /100 | #204 | Poor 17.1% |
| Aleuts | 13.9 /100 | #205 | Poor 17.1% |
| Alaska Natives | 11.8 /100 | #206 | Poor 17.2% |
| German Russians | 8.6 /100 | #207 | Tragic 17.4% |
| Pennsylvania Germans | 7.5 /100 | #208 | Tragic 17.4% |
| Panamanians | 6.9 /100 | #209 | Tragic 17.5% |
| Alaskan Athabascans | 6.9 /100 | #210 | Tragic 17.5% |
| Immigrants | Thailand | 6.6 /100 | #211 | Tragic 17.5% |
| Immigrants | Immigrants | 6.5 /100 | #212 | Tragic 17.5% |
| Immigrants | Azores | 6.2 /100 | #213 | Tragic 17.5% |
| Iraqis | 5.9 /100 | #214 | Tragic 17.5% |
| Malaysians | 5.9 /100 | #215 | Tragic 17.5% |
| Sierra Leoneans | 5.7 /100 | #216 | Tragic 17.6% |
| Immigrants | Eastern Africa | 5.3 /100 | #217 | Tragic 17.6% |
| Moroccans | 5.3 /100 | #218 | Tragic 17.6% |
| Japanese | 4.7 /100 | #219 | Tragic 17.7% |
| Immigrants | Panama | 4.1 /100 | #220 | Tragic 17.7% |
| Cubans | 3.7 /100 | #221 | Tragic 17.8% |