Immigrants from Southern Europe vs Immigrants from Grenada Single Father Poverty
COMPARE
Immigrants from Southern Europe
Immigrants from Grenada
Single Father Poverty
Single Father Poverty Comparison
Immigrants from Southern Europe
Immigrants from Grenada
16.7%
SINGLE FATHER POVERTY
11.2/ 100
METRIC RATING
212th/ 347
METRIC RANK
16.9%
SINGLE FATHER POVERTY
3.7/ 100
METRIC RATING
232nd/ 347
METRIC RANK
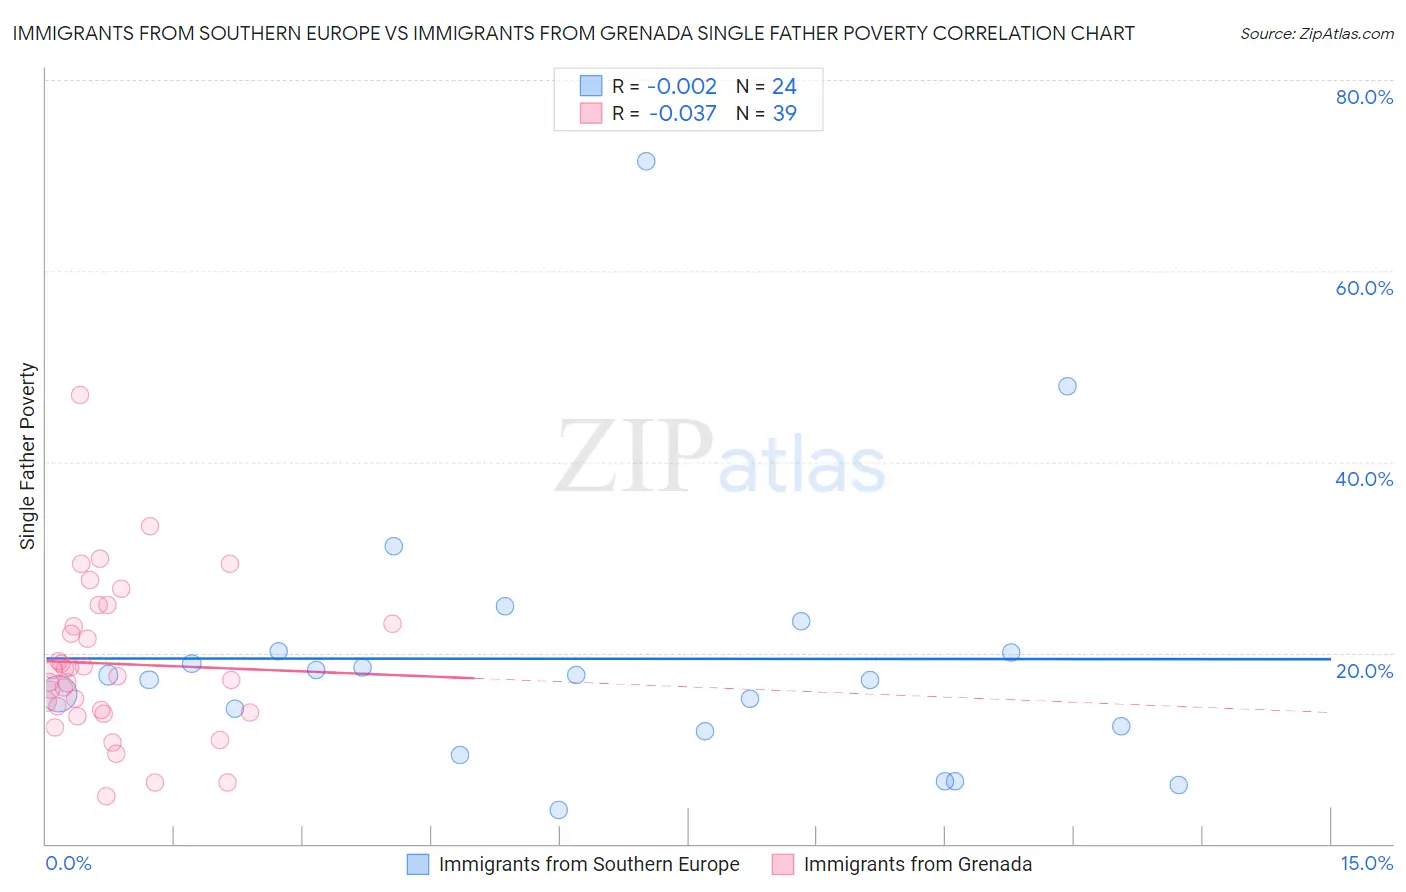
Immigrants from Southern Europe vs Immigrants from Grenada Single Father Poverty Correlation Chart
The statistical analysis conducted on geographies consisting of 311,843,806 people shows no correlation between the proportion of Immigrants from Southern Europe and poverty level among single fathers in the United States with a correlation coefficient (R) of -0.002 and weighted average of 16.7%. Similarly, the statistical analysis conducted on geographies consisting of 62,119,741 people shows no correlation between the proportion of Immigrants from Grenada and poverty level among single fathers in the United States with a correlation coefficient (R) of -0.037 and weighted average of 16.9%, a difference of 1.3%.
Single Father Poverty Correlation Summary
| Measurement | Immigrants from Southern Europe | Immigrants from Grenada |
| Minimum | 3.6% | 5.0% |
| Maximum | 71.4% | 47.0% |
| Range | 67.9% | 42.0% |
| Mean | 19.4% | 18.9% |
| Median | 17.4% | 17.6% |
| Interquartile 25% (IQ1) | 12.0% | 13.7% |
| Interquartile 75% (IQ3) | 20.1% | 23.1% |
| Interquartile Range (IQR) | 8.1% | 9.4% |
| Standard Deviation (Sample) | 14.4% | 8.2% |
| Standard Deviation (Population) | 14.1% | 8.1% |
Demographics Similar to Immigrants from Southern Europe and Immigrants from Grenada by Single Father Poverty
In terms of single father poverty, the demographic groups most similar to Immigrants from Southern Europe are Ghanaian (16.7%, a difference of 0.020%), Spanish (16.7%, a difference of 0.050%), Immigrants from Scotland (16.7%, a difference of 0.19%), Immigrants from England (16.7%, a difference of 0.19%), and Cheyenne (16.7%, a difference of 0.22%). Similarly, the demographic groups most similar to Immigrants from Grenada are Spanish American (16.9%, a difference of 0.020%), Immigrants from Trinidad and Tobago (16.8%, a difference of 0.23%), Israeli (16.8%, a difference of 0.26%), Belgian (16.8%, a difference of 0.42%), and British (16.8%, a difference of 0.48%).
| Demographics | Rating | Rank | Single Father Poverty |
| Immigrants | Southern Europe | 11.2 /100 | #212 | Poor 16.7% |
| Ghanaians | 11.0 /100 | #213 | Poor 16.7% |
| Spanish | 10.7 /100 | #214 | Poor 16.7% |
| Immigrants | Scotland | 9.6 /100 | #215 | Tragic 16.7% |
| Immigrants | England | 9.5 /100 | #216 | Tragic 16.7% |
| Cheyenne | 9.3 /100 | #217 | Tragic 16.7% |
| Immigrants | Uganda | 8.6 /100 | #218 | Tragic 16.7% |
| Immigrants | Ghana | 8.1 /100 | #219 | Tragic 16.7% |
| Immigrants | Denmark | 8.1 /100 | #220 | Tragic 16.7% |
| Immigrants | Greece | 8.1 /100 | #221 | Tragic 16.7% |
| Immigrants | Spain | 8.0 /100 | #222 | Tragic 16.7% |
| Immigrants | Austria | 7.0 /100 | #223 | Tragic 16.8% |
| Immigrants | Norway | 6.5 /100 | #224 | Tragic 16.8% |
| Menominee | 6.4 /100 | #225 | Tragic 16.8% |
| Hispanics or Latinos | 6.1 /100 | #226 | Tragic 16.8% |
| British | 5.6 /100 | #227 | Tragic 16.8% |
| Belgians | 5.3 /100 | #228 | Tragic 16.8% |
| Israelis | 4.6 /100 | #229 | Tragic 16.8% |
| Immigrants | Trinidad and Tobago | 4.5 /100 | #230 | Tragic 16.8% |
| Spanish Americans | 3.7 /100 | #231 | Tragic 16.9% |
| Immigrants | Grenada | 3.7 /100 | #232 | Tragic 16.9% |