Scottish vs American Child Poverty Among Boys Under 16
COMPARE
Scottish
American
Child Poverty Among Boys Under 16
Child Poverty Among Boys Under 16 Comparison
Scottish
Americans
15.2%
CHILD POVERTY AMONG BOYS UNDER 16
93.0/ 100
METRIC RATING
121st/ 347
METRIC RANK
18.6%
CHILD POVERTY AMONG BOYS UNDER 16
0.9/ 100
METRIC RATING
235th/ 347
METRIC RANK
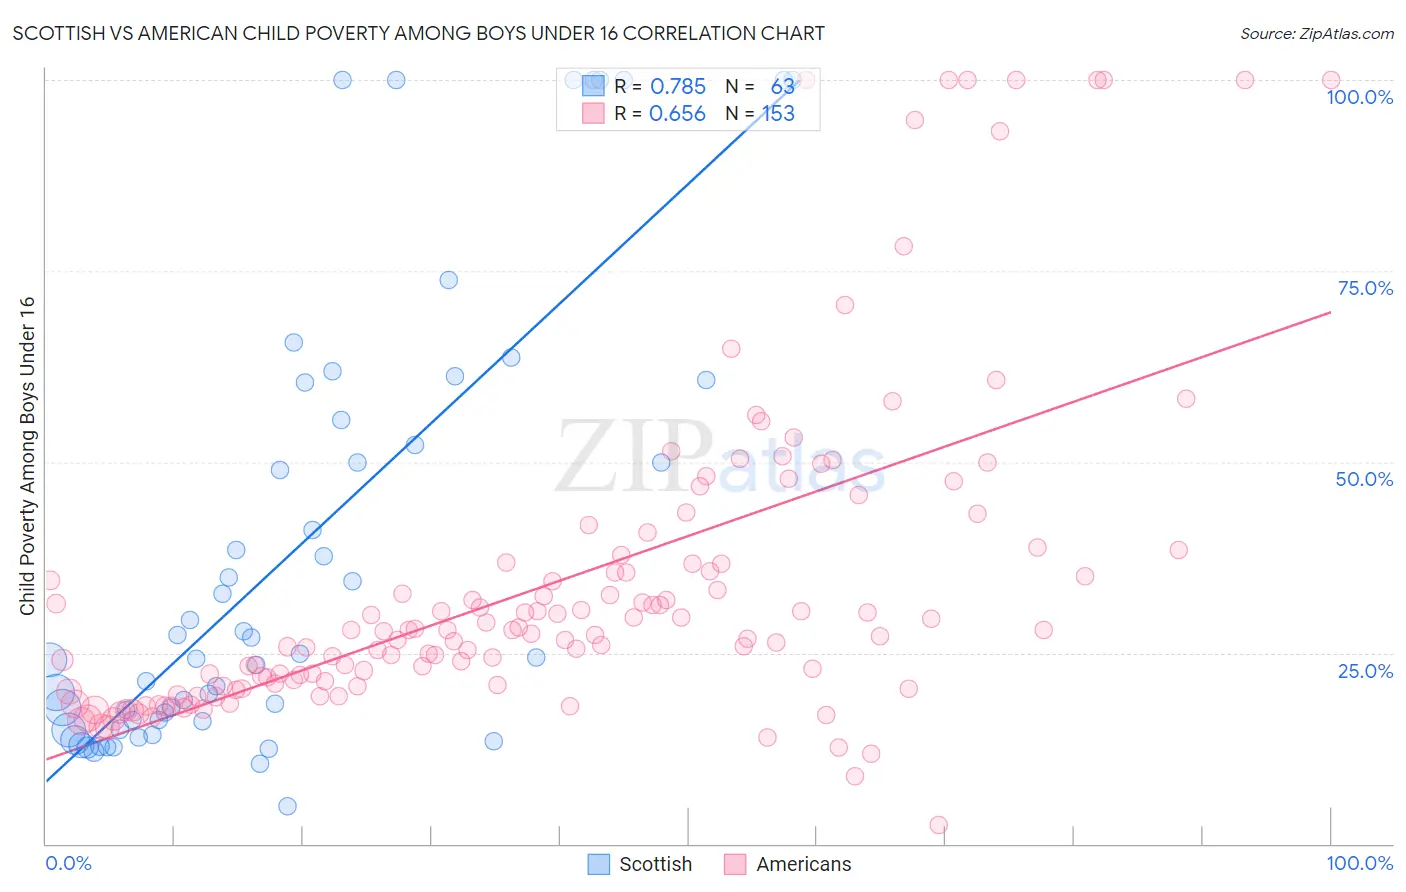
Scottish vs American Child Poverty Among Boys Under 16 Correlation Chart
The statistical analysis conducted on geographies consisting of 546,371,305 people shows a strong positive correlation between the proportion of Scottish and poverty level among boys under the age of 16 in the United States with a correlation coefficient (R) of 0.785 and weighted average of 15.2%. Similarly, the statistical analysis conducted on geographies consisting of 559,344,649 people shows a significant positive correlation between the proportion of Americans and poverty level among boys under the age of 16 in the United States with a correlation coefficient (R) of 0.656 and weighted average of 18.6%, a difference of 21.9%.
Child Poverty Among Boys Under 16 Correlation Summary
| Measurement | Scottish | American |
| Minimum | 5.0% | 2.5% |
| Maximum | 100.0% | 100.0% |
| Range | 95.0% | 97.5% |
| Mean | 37.8% | 33.9% |
| Median | 24.3% | 27.8% |
| Interquartile 25% (IQ1) | 16.0% | 20.8% |
| Interquartile 75% (IQ3) | 55.6% | 36.7% |
| Interquartile Range (IQR) | 39.5% | 16.0% |
| Standard Deviation (Sample) | 29.2% | 21.1% |
| Standard Deviation (Population) | 29.0% | 21.1% |
Similar Demographics by Child Poverty Among Boys Under 16
Demographics Similar to Scottish by Child Poverty Among Boys Under 16
In terms of child poverty among boys under 16, the demographic groups most similar to Scottish are South African (15.2%, a difference of 0.010%), Belgian (15.2%, a difference of 0.060%), Immigrants from Malaysia (15.3%, a difference of 0.10%), Native Hawaiian (15.2%, a difference of 0.18%), and Immigrants from Vietnam (15.2%, a difference of 0.24%).
| Demographics | Rating | Rank | Child Poverty Among Boys Under 16 |
| Immigrants | Ukraine | 93.6 /100 | #114 | Exceptional 15.2% |
| Armenians | 93.6 /100 | #115 | Exceptional 15.2% |
| Immigrants | South Eastern Asia | 93.5 /100 | #116 | Exceptional 15.2% |
| Immigrants | Vietnam | 93.5 /100 | #117 | Exceptional 15.2% |
| Native Hawaiians | 93.4 /100 | #118 | Exceptional 15.2% |
| Belgians | 93.1 /100 | #119 | Exceptional 15.2% |
| South Africans | 93.0 /100 | #120 | Exceptional 15.2% |
| Scottish | 93.0 /100 | #121 | Exceptional 15.2% |
| Immigrants | Malaysia | 92.8 /100 | #122 | Exceptional 15.3% |
| Immigrants | Norway | 92.3 /100 | #123 | Exceptional 15.3% |
| Tlingit-Haida | 92.2 /100 | #124 | Exceptional 15.3% |
| Czechoslovakians | 92.1 /100 | #125 | Exceptional 15.3% |
| Palestinians | 91.3 /100 | #126 | Exceptional 15.4% |
| Carpatho Rusyns | 91.1 /100 | #127 | Exceptional 15.4% |
| Canadians | 90.6 /100 | #128 | Exceptional 15.4% |
Demographics Similar to Americans by Child Poverty Among Boys Under 16
In terms of child poverty among boys under 16, the demographic groups most similar to Americans are Sudanese (18.6%, a difference of 0.090%), Immigrants from Eritrea (18.6%, a difference of 0.24%), Immigrants from Laos (18.7%, a difference of 0.46%), Nigerian (18.5%, a difference of 0.50%), and Cape Verdean (18.7%, a difference of 0.70%).
| Demographics | Rating | Rank | Child Poverty Among Boys Under 16 |
| Immigrants | Nonimmigrants | 2.2 /100 | #228 | Tragic 18.2% |
| Immigrants | Micronesia | 1.8 /100 | #229 | Tragic 18.3% |
| Fijians | 1.8 /100 | #230 | Tragic 18.3% |
| Nicaraguans | 1.4 /100 | #231 | Tragic 18.4% |
| Marshallese | 1.3 /100 | #232 | Tragic 18.4% |
| Immigrants | Nigeria | 1.2 /100 | #233 | Tragic 18.4% |
| Nigerians | 1.1 /100 | #234 | Tragic 18.5% |
| Americans | 0.9 /100 | #235 | Tragic 18.6% |
| Sudanese | 0.9 /100 | #236 | Tragic 18.6% |
| Immigrants | Eritrea | 0.8 /100 | #237 | Tragic 18.6% |
| Immigrants | Laos | 0.8 /100 | #238 | Tragic 18.7% |
| Cape Verdeans | 0.7 /100 | #239 | Tragic 18.7% |
| Immigrants | Cuba | 0.6 /100 | #240 | Tragic 18.8% |
| Immigrants | Sudan | 0.6 /100 | #241 | Tragic 18.8% |
| Ghanaians | 0.5 /100 | #242 | Tragic 18.9% |