Scotch-Irish vs Ugandan Seniors Poverty Over the Age of 75
COMPARE
Scotch-Irish
Ugandan
Seniors Poverty Over the Age of 75
Seniors Poverty Over the Age of 75 Comparison
Scotch-Irish
Ugandans
10.8%
SENIORS POVERTY OVER THE AGE OF 75
99.6/ 100
METRIC RATING
36th/ 347
METRIC RANK
11.9%
SENIORS POVERTY OVER THE AGE OF 75
77.1/ 100
METRIC RATING
134th/ 347
METRIC RANK
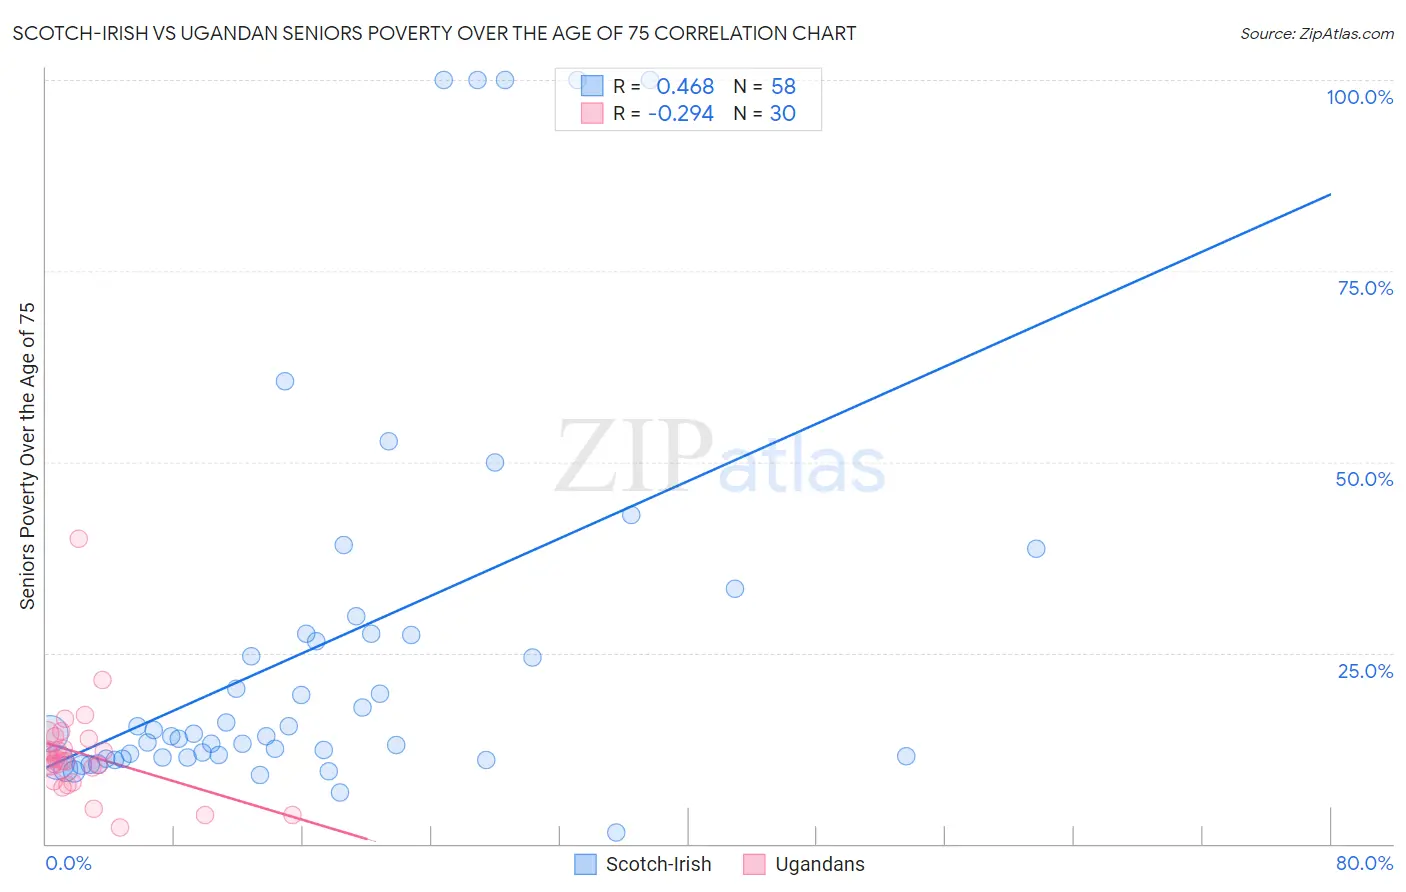
Scotch-Irish vs Ugandan Seniors Poverty Over the Age of 75 Correlation Chart
The statistical analysis conducted on geographies consisting of 534,526,562 people shows a moderate positive correlation between the proportion of Scotch-Irish and poverty level among seniors over the age of 75 in the United States with a correlation coefficient (R) of 0.468 and weighted average of 10.8%. Similarly, the statistical analysis conducted on geographies consisting of 93,703,303 people shows a weak negative correlation between the proportion of Ugandans and poverty level among seniors over the age of 75 in the United States with a correlation coefficient (R) of -0.294 and weighted average of 11.9%, a difference of 10.0%.
Seniors Poverty Over the Age of 75 Correlation Summary
| Measurement | Scotch-Irish | Ugandan |
| Minimum | 1.4% | 2.1% |
| Maximum | 100.0% | 40.0% |
| Range | 98.6% | 37.9% |
| Mean | 25.7% | 11.8% |
| Median | 14.2% | 10.9% |
| Interquartile 25% (IQ1) | 11.2% | 8.2% |
| Interquartile 75% (IQ3) | 27.4% | 13.8% |
| Interquartile Range (IQR) | 16.2% | 5.5% |
| Standard Deviation (Sample) | 25.9% | 6.7% |
| Standard Deviation (Population) | 25.6% | 6.6% |
Similar Demographics by Seniors Poverty Over the Age of 75
Demographics Similar to Scotch-Irish by Seniors Poverty Over the Age of 75
In terms of seniors poverty over the age of 75, the demographic groups most similar to Scotch-Irish are Luxembourger (10.8%, a difference of 0.050%), Latvian (10.8%, a difference of 0.16%), Finnish (10.8%, a difference of 0.30%), Italian (10.8%, a difference of 0.43%), and Puget Sound Salish (10.8%, a difference of 0.49%).
| Demographics | Rating | Rank | Seniors Poverty Over the Age of 75 |
| Assyrians/Chaldeans/Syriacs | 99.8 /100 | #29 | Exceptional 10.7% |
| Swiss | 99.7 /100 | #30 | Exceptional 10.7% |
| Marshallese | 99.7 /100 | #31 | Exceptional 10.7% |
| British | 99.7 /100 | #32 | Exceptional 10.7% |
| Puget Sound Salish | 99.7 /100 | #33 | Exceptional 10.8% |
| Italians | 99.7 /100 | #34 | Exceptional 10.8% |
| Luxembourgers | 99.6 /100 | #35 | Exceptional 10.8% |
| Scotch-Irish | 99.6 /100 | #36 | Exceptional 10.8% |
| Latvians | 99.6 /100 | #37 | Exceptional 10.8% |
| Finns | 99.6 /100 | #38 | Exceptional 10.8% |
| Czechoslovakians | 99.4 /100 | #39 | Exceptional 10.9% |
| Thais | 99.4 /100 | #40 | Exceptional 10.9% |
| Immigrants | Lithuania | 99.2 /100 | #41 | Exceptional 11.0% |
| Austrians | 99.1 /100 | #42 | Exceptional 11.0% |
| Celtics | 99.1 /100 | #43 | Exceptional 11.0% |
Demographics Similar to Ugandans by Seniors Poverty Over the Age of 75
In terms of seniors poverty over the age of 75, the demographic groups most similar to Ugandans are Immigrants from Sierra Leone (11.9%, a difference of 0.060%), Immigrants from Ireland (11.9%, a difference of 0.10%), Lebanese (11.9%, a difference of 0.15%), Immigrants from Philippines (11.9%, a difference of 0.24%), and Immigrants from Western Europe (11.9%, a difference of 0.31%).
| Demographics | Rating | Rank | Seniors Poverty Over the Age of 75 |
| Immigrants | Denmark | 82.6 /100 | #127 | Excellent 11.8% |
| Immigrants | Hungary | 81.7 /100 | #128 | Excellent 11.8% |
| Ethiopians | 80.7 /100 | #129 | Excellent 11.8% |
| Spanish | 80.5 /100 | #130 | Excellent 11.8% |
| Immigrants | Western Europe | 79.6 /100 | #131 | Good 11.9% |
| Lebanese | 78.3 /100 | #132 | Good 11.9% |
| Immigrants | Sierra Leone | 77.6 /100 | #133 | Good 11.9% |
| Ugandans | 77.1 /100 | #134 | Good 11.9% |
| Immigrants | Ireland | 76.2 /100 | #135 | Good 11.9% |
| Immigrants | Philippines | 75.0 /100 | #136 | Good 11.9% |
| Immigrants | Moldova | 74.1 /100 | #137 | Good 11.9% |
| Immigrants | Romania | 72.6 /100 | #138 | Good 11.9% |
| Immigrants | Kenya | 72.6 /100 | #139 | Good 11.9% |
| Immigrants | Pakistan | 71.9 /100 | #140 | Good 12.0% |
| Immigrants | Cameroon | 71.7 /100 | #141 | Good 12.0% |