Immigrants from Eritrea vs Paiute Child Poverty Under the Age of 5
COMPARE
Immigrants from Eritrea
Paiute
Child Poverty Under the Age of 5
Child Poverty Under the Age of 5 Comparison
Immigrants from Eritrea
Paiute
19.1%
CHILD POVERTY UNDER THE AGE OF 5
1.5/ 100
METRIC RATING
226th/ 347
METRIC RANK
23.8%
CHILD POVERTY UNDER THE AGE OF 5
0.0/ 100
METRIC RATING
324th/ 347
METRIC RANK
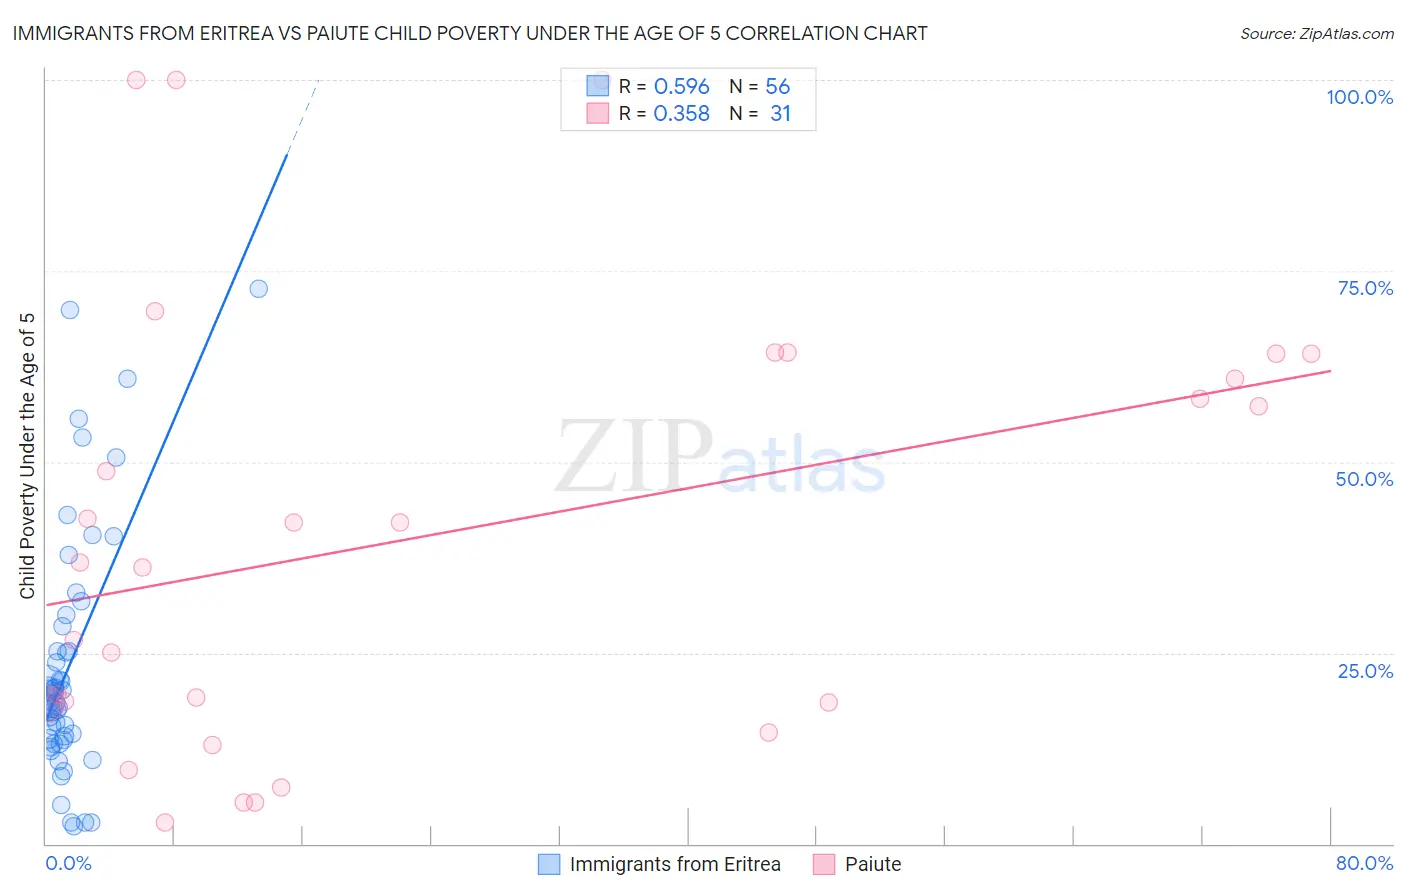
Immigrants from Eritrea vs Paiute Child Poverty Under the Age of 5 Correlation Chart
The statistical analysis conducted on geographies consisting of 103,980,872 people shows a substantial positive correlation between the proportion of Immigrants from Eritrea and poverty level among children under the age of 5 in the United States with a correlation coefficient (R) of 0.596 and weighted average of 19.1%. Similarly, the statistical analysis conducted on geographies consisting of 58,012,157 people shows a mild positive correlation between the proportion of Paiute and poverty level among children under the age of 5 in the United States with a correlation coefficient (R) of 0.358 and weighted average of 23.8%, a difference of 24.8%.
Child Poverty Under the Age of 5 Correlation Summary
| Measurement | Immigrants from Eritrea | Paiute |
| Minimum | 2.3% | 2.7% |
| Maximum | 72.7% | 100.0% |
| Range | 70.4% | 97.3% |
| Mean | 23.3% | 40.5% |
| Median | 19.0% | 36.7% |
| Interquartile 25% (IQ1) | 13.6% | 18.4% |
| Interquartile 75% (IQ3) | 26.8% | 64.1% |
| Interquartile Range (IQR) | 13.2% | 45.7% |
| Standard Deviation (Sample) | 16.1% | 28.9% |
| Standard Deviation (Population) | 15.9% | 28.4% |
Similar Demographics by Child Poverty Under the Age of 5
Demographics Similar to Immigrants from Eritrea by Child Poverty Under the Age of 5
In terms of child poverty under the age of 5, the demographic groups most similar to Immigrants from Eritrea are Nigerian (19.1%, a difference of 0.020%), Nicaraguan (19.1%, a difference of 0.050%), Cuban (19.1%, a difference of 0.16%), Alsatian (19.1%, a difference of 0.18%), and Cape Verdean (19.1%, a difference of 0.18%).
| Demographics | Rating | Rank | Child Poverty Under the Age of 5 |
| German Russians | 3.0 /100 | #219 | Tragic 18.8% |
| Immigrants | Azores | 2.6 /100 | #220 | Tragic 18.9% |
| Immigrants | Nigeria | 2.1 /100 | #221 | Tragic 19.0% |
| Alsatians | 1.7 /100 | #222 | Tragic 19.1% |
| Cubans | 1.7 /100 | #223 | Tragic 19.1% |
| Nicaraguans | 1.6 /100 | #224 | Tragic 19.1% |
| Nigerians | 1.6 /100 | #225 | Tragic 19.1% |
| Immigrants | Eritrea | 1.5 /100 | #226 | Tragic 19.1% |
| Cape Verdeans | 1.4 /100 | #227 | Tragic 19.1% |
| Immigrants | Sudan | 1.3 /100 | #228 | Tragic 19.2% |
| Ghanaians | 1.2 /100 | #229 | Tragic 19.2% |
| Ecuadorians | 1.2 /100 | #230 | Tragic 19.2% |
| Bermudans | 1.2 /100 | #231 | Tragic 19.2% |
| Trinidadians and Tobagonians | 0.9 /100 | #232 | Tragic 19.3% |
| Sudanese | 0.9 /100 | #233 | Tragic 19.3% |
Demographics Similar to Paiute by Child Poverty Under the Age of 5
In terms of child poverty under the age of 5, the demographic groups most similar to Paiute are Immigrants from Congo (23.9%, a difference of 0.21%), Central American Indian (23.9%, a difference of 0.39%), Pueblo (23.7%, a difference of 0.61%), Dominican (24.0%, a difference of 0.85%), and Immigrants from Dominican Republic (24.1%, a difference of 0.94%).
| Demographics | Rating | Rank | Child Poverty Under the Age of 5 |
| Menominee | 0.0 /100 | #317 | Tragic 23.3% |
| Dutch West Indians | 0.0 /100 | #318 | Tragic 23.3% |
| Chippewa | 0.0 /100 | #319 | Tragic 23.4% |
| Choctaw | 0.0 /100 | #320 | Tragic 23.5% |
| Immigrants | Honduras | 0.0 /100 | #321 | Tragic 23.5% |
| Ute | 0.0 /100 | #322 | Tragic 23.5% |
| Pueblo | 0.0 /100 | #323 | Tragic 23.7% |
| Paiute | 0.0 /100 | #324 | Tragic 23.8% |
| Immigrants | Congo | 0.0 /100 | #325 | Tragic 23.9% |
| Central American Indians | 0.0 /100 | #326 | Tragic 23.9% |
| Dominicans | 0.0 /100 | #327 | Tragic 24.0% |
| Immigrants | Dominican Republic | 0.0 /100 | #328 | Tragic 24.1% |
| Cajuns | 0.0 /100 | #329 | Tragic 24.1% |
| Creek | 0.0 /100 | #330 | Tragic 24.2% |
| Kiowa | 0.0 /100 | #331 | Tragic 24.5% |