Scandinavian vs Korean Child Poverty Among Girls Under 16
COMPARE
Scandinavian
Korean
Child Poverty Among Girls Under 16
Child Poverty Among Girls Under 16 Comparison
Scandinavians
Koreans
14.4%
CHILD POVERTY AMONG GIRLS UNDER 16
98.7/ 100
METRIC RATING
62nd/ 347
METRIC RANK
14.1%
CHILD POVERTY AMONG GIRLS UNDER 16
99.4/ 100
METRIC RATING
43rd/ 347
METRIC RANK
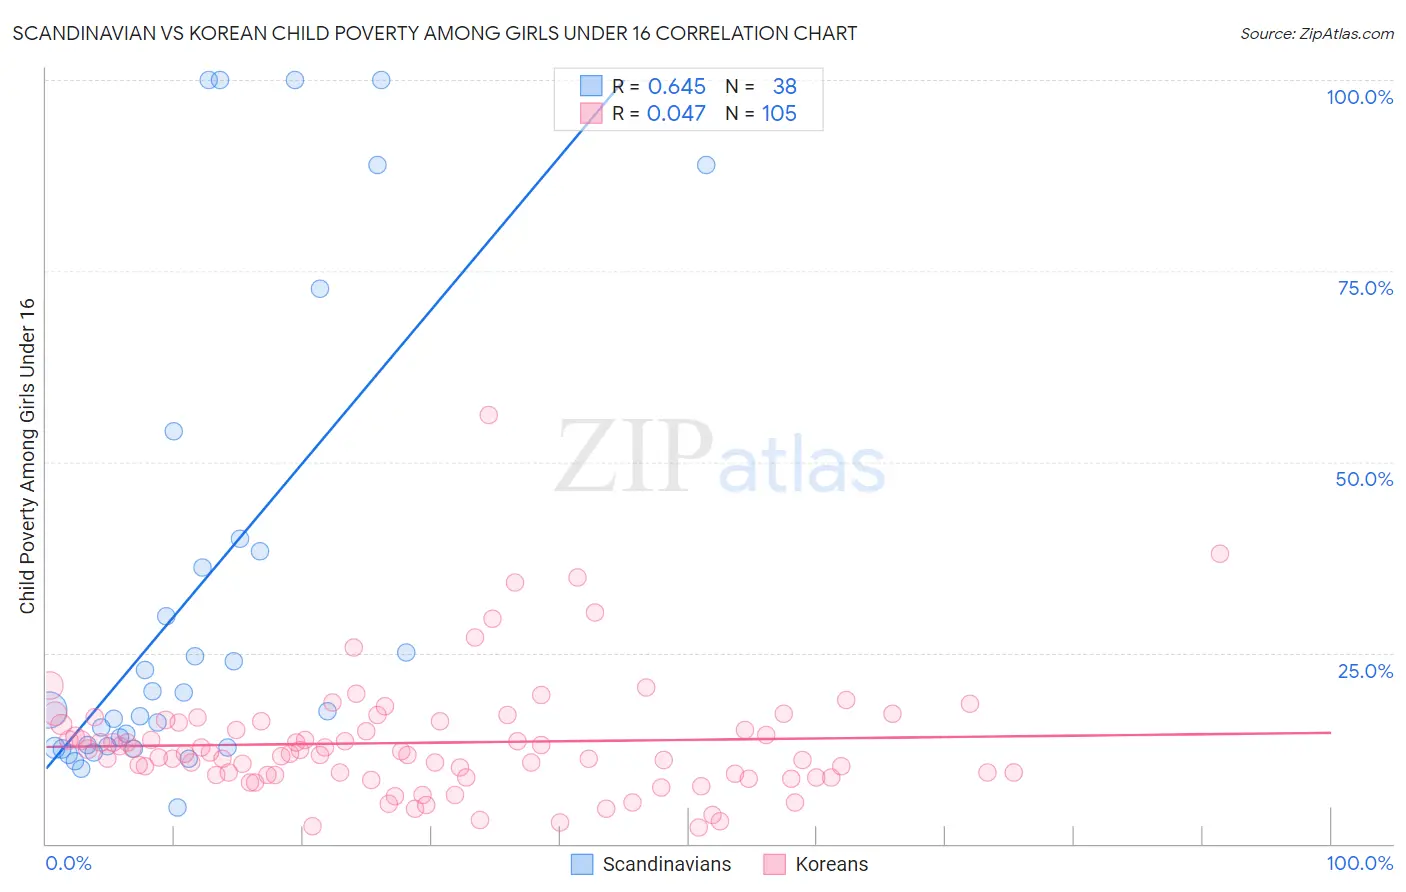
Scandinavian vs Korean Child Poverty Among Girls Under 16 Correlation Chart
The statistical analysis conducted on geographies consisting of 459,652,874 people shows a significant positive correlation between the proportion of Scandinavians and poverty level among girls under the age of 16 in the United States with a correlation coefficient (R) of 0.645 and weighted average of 14.4%. Similarly, the statistical analysis conducted on geographies consisting of 497,455,609 people shows no correlation between the proportion of Koreans and poverty level among girls under the age of 16 in the United States with a correlation coefficient (R) of 0.047 and weighted average of 14.1%, a difference of 2.7%.
Child Poverty Among Girls Under 16 Correlation Summary
| Measurement | Scandinavian | Korean |
| Minimum | 4.8% | 2.1% |
| Maximum | 100.0% | 56.1% |
| Range | 95.2% | 54.0% |
| Mean | 32.8% | 13.2% |
| Median | 17.5% | 11.8% |
| Interquartile 25% (IQ1) | 12.7% | 9.0% |
| Interquartile 75% (IQ3) | 38.4% | 16.0% |
| Interquartile Range (IQR) | 25.7% | 7.0% |
| Standard Deviation (Sample) | 30.8% | 7.8% |
| Standard Deviation (Population) | 30.4% | 7.8% |
Demographics Similar to Scandinavians and Koreans by Child Poverty Among Girls Under 16
In terms of child poverty among girls under 16, the demographic groups most similar to Scandinavians are Cambodian (14.4%, a difference of 0.11%), Polish (14.4%, a difference of 0.12%), Zimbabwean (14.4%, a difference of 0.31%), Immigrants from Bulgaria (14.4%, a difference of 0.37%), and Immigrants from Serbia (14.4%, a difference of 0.46%). Similarly, the demographic groups most similar to Koreans are Immigrants from Scotland (14.0%, a difference of 0.14%), Immigrants from Asia (14.1%, a difference of 0.14%), Immigrants from Greece (14.1%, a difference of 0.65%), Croatian (14.1%, a difference of 0.68%), and Immigrants from Czechoslovakia (14.2%, a difference of 0.71%).
| Demographics | Rating | Rank | Child Poverty Among Girls Under 16 |
| Immigrants | Scotland | 99.4 /100 | #42 | Exceptional 14.0% |
| Koreans | 99.4 /100 | #43 | Exceptional 14.1% |
| Immigrants | Asia | 99.4 /100 | #44 | Exceptional 14.1% |
| Immigrants | Greece | 99.3 /100 | #45 | Exceptional 14.1% |
| Croatians | 99.3 /100 | #46 | Exceptional 14.1% |
| Immigrants | Czechoslovakia | 99.3 /100 | #47 | Exceptional 14.2% |
| Czechs | 99.3 /100 | #48 | Exceptional 14.2% |
| Greeks | 99.2 /100 | #49 | Exceptional 14.2% |
| Immigrants | Israel | 99.2 /100 | #50 | Exceptional 14.2% |
| Immigrants | Pakistan | 99.1 /100 | #51 | Exceptional 14.2% |
| Italians | 99.1 /100 | #52 | Exceptional 14.3% |
| Luxembourgers | 99.0 /100 | #53 | Exceptional 14.3% |
| Estonians | 98.9 /100 | #54 | Exceptional 14.3% |
| Immigrants | Romania | 98.9 /100 | #55 | Exceptional 14.3% |
| Immigrants | Indonesia | 98.9 /100 | #56 | Exceptional 14.4% |
| Immigrants | Serbia | 98.9 /100 | #57 | Exceptional 14.4% |
| Immigrants | Bulgaria | 98.8 /100 | #58 | Exceptional 14.4% |
| Zimbabweans | 98.8 /100 | #59 | Exceptional 14.4% |
| Poles | 98.7 /100 | #60 | Exceptional 14.4% |
| Cambodians | 98.7 /100 | #61 | Exceptional 14.4% |
| Scandinavians | 98.7 /100 | #62 | Exceptional 14.4% |