Scandinavian vs Bahamian Child Poverty Among Girls Under 16
COMPARE
Scandinavian
Bahamian
Child Poverty Among Girls Under 16
Child Poverty Among Girls Under 16 Comparison
Scandinavians
Bahamians
14.4%
CHILD POVERTY AMONG GIRLS UNDER 16
98.7/ 100
METRIC RATING
62nd/ 347
METRIC RANK
21.5%
CHILD POVERTY AMONG GIRLS UNDER 16
0.0/ 100
METRIC RATING
309th/ 347
METRIC RANK
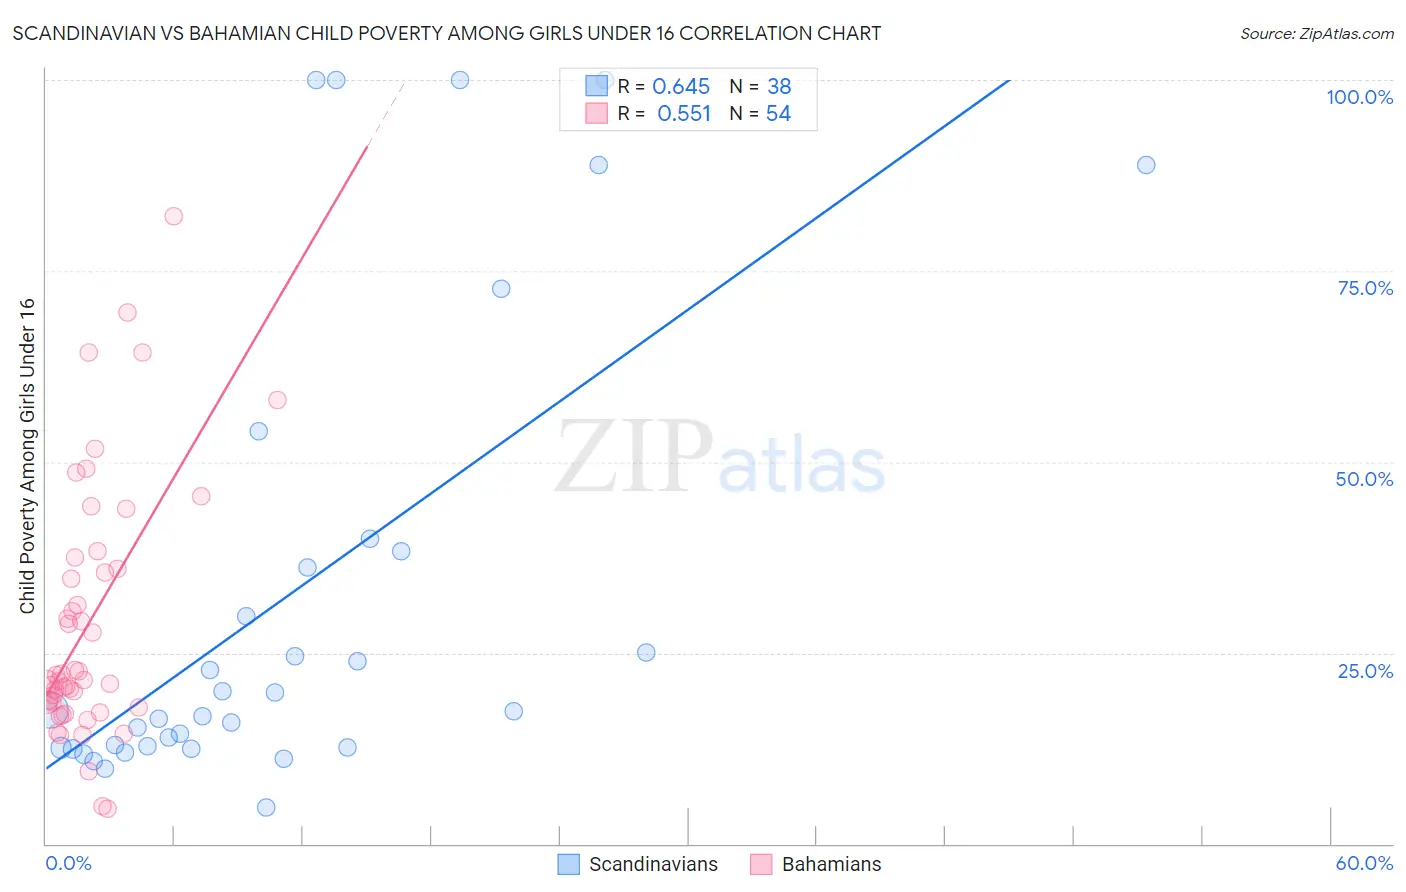
Scandinavian vs Bahamian Child Poverty Among Girls Under 16 Correlation Chart
The statistical analysis conducted on geographies consisting of 459,652,874 people shows a significant positive correlation between the proportion of Scandinavians and poverty level among girls under the age of 16 in the United States with a correlation coefficient (R) of 0.645 and weighted average of 14.4%. Similarly, the statistical analysis conducted on geographies consisting of 112,230,228 people shows a substantial positive correlation between the proportion of Bahamians and poverty level among girls under the age of 16 in the United States with a correlation coefficient (R) of 0.551 and weighted average of 21.5%, a difference of 49.1%.
Child Poverty Among Girls Under 16 Correlation Summary
| Measurement | Scandinavian | Bahamian |
| Minimum | 4.8% | 4.6% |
| Maximum | 100.0% | 82.1% |
| Range | 95.2% | 77.5% |
| Mean | 32.8% | 28.7% |
| Median | 17.5% | 21.4% |
| Interquartile 25% (IQ1) | 12.7% | 18.2% |
| Interquartile 75% (IQ3) | 38.4% | 36.0% |
| Interquartile Range (IQR) | 25.7% | 17.8% |
| Standard Deviation (Sample) | 30.8% | 16.7% |
| Standard Deviation (Population) | 30.4% | 16.5% |
Similar Demographics by Child Poverty Among Girls Under 16
Demographics Similar to Scandinavians by Child Poverty Among Girls Under 16
In terms of child poverty among girls under 16, the demographic groups most similar to Scandinavians are Immigrants from Europe (14.4%, a difference of 0.050%), Cambodian (14.4%, a difference of 0.11%), Polish (14.4%, a difference of 0.12%), Immigrants from Philippines (14.4%, a difference of 0.16%), and Immigrants from Sweden (14.5%, a difference of 0.19%).
| Demographics | Rating | Rank | Child Poverty Among Girls Under 16 |
| Immigrants | Romania | 98.9 /100 | #55 | Exceptional 14.3% |
| Immigrants | Indonesia | 98.9 /100 | #56 | Exceptional 14.4% |
| Immigrants | Serbia | 98.9 /100 | #57 | Exceptional 14.4% |
| Immigrants | Bulgaria | 98.8 /100 | #58 | Exceptional 14.4% |
| Zimbabweans | 98.8 /100 | #59 | Exceptional 14.4% |
| Poles | 98.7 /100 | #60 | Exceptional 14.4% |
| Cambodians | 98.7 /100 | #61 | Exceptional 14.4% |
| Scandinavians | 98.7 /100 | #62 | Exceptional 14.4% |
| Immigrants | Europe | 98.7 /100 | #63 | Exceptional 14.4% |
| Immigrants | Philippines | 98.6 /100 | #64 | Exceptional 14.4% |
| Immigrants | Sweden | 98.6 /100 | #65 | Exceptional 14.5% |
| Immigrants | Belgium | 98.5 /100 | #66 | Exceptional 14.5% |
| Laotians | 98.4 /100 | #67 | Exceptional 14.5% |
| Immigrants | Argentina | 98.3 /100 | #68 | Exceptional 14.6% |
| Immigrants | Poland | 98.2 /100 | #69 | Exceptional 14.6% |
Demographics Similar to Bahamians by Child Poverty Among Girls Under 16
In terms of child poverty among girls under 16, the demographic groups most similar to Bahamians are Houma (21.5%, a difference of 0.12%), Immigrants from Somalia (21.6%, a difference of 0.27%), Immigrants from Bahamas (21.4%, a difference of 0.30%), Immigrants from Central America (21.4%, a difference of 0.31%), and Dutch West Indian (21.6%, a difference of 0.33%).
| Demographics | Rating | Rank | Child Poverty Among Girls Under 16 |
| Seminole | 0.0 /100 | #302 | Tragic 21.2% |
| British West Indians | 0.0 /100 | #303 | Tragic 21.3% |
| Indonesians | 0.0 /100 | #304 | Tragic 21.3% |
| Guatemalans | 0.0 /100 | #305 | Tragic 21.4% |
| Immigrants | Central America | 0.0 /100 | #306 | Tragic 21.4% |
| Immigrants | Bahamas | 0.0 /100 | #307 | Tragic 21.4% |
| Houma | 0.0 /100 | #308 | Tragic 21.5% |
| Bahamians | 0.0 /100 | #309 | Tragic 21.5% |
| Immigrants | Somalia | 0.0 /100 | #310 | Tragic 21.6% |
| Dutch West Indians | 0.0 /100 | #311 | Tragic 21.6% |
| Immigrants | Mexico | 0.0 /100 | #312 | Tragic 21.6% |
| Creek | 0.0 /100 | #313 | Tragic 21.7% |
| Arapaho | 0.0 /100 | #314 | Tragic 21.7% |
| Ute | 0.0 /100 | #315 | Tragic 21.8% |
| Immigrants | Guatemala | 0.0 /100 | #316 | Tragic 21.9% |