Scandinavian vs Korean 3rd Grade
COMPARE
Scandinavian
Korean
3rd Grade
3rd Grade Comparison
Scandinavians
Koreans
98.4%
3RD GRADE
100.0/ 100
METRIC RATING
32nd/ 347
METRIC RANK
97.4%
3RD GRADE
1.3/ 100
METRIC RATING
242nd/ 347
METRIC RANK
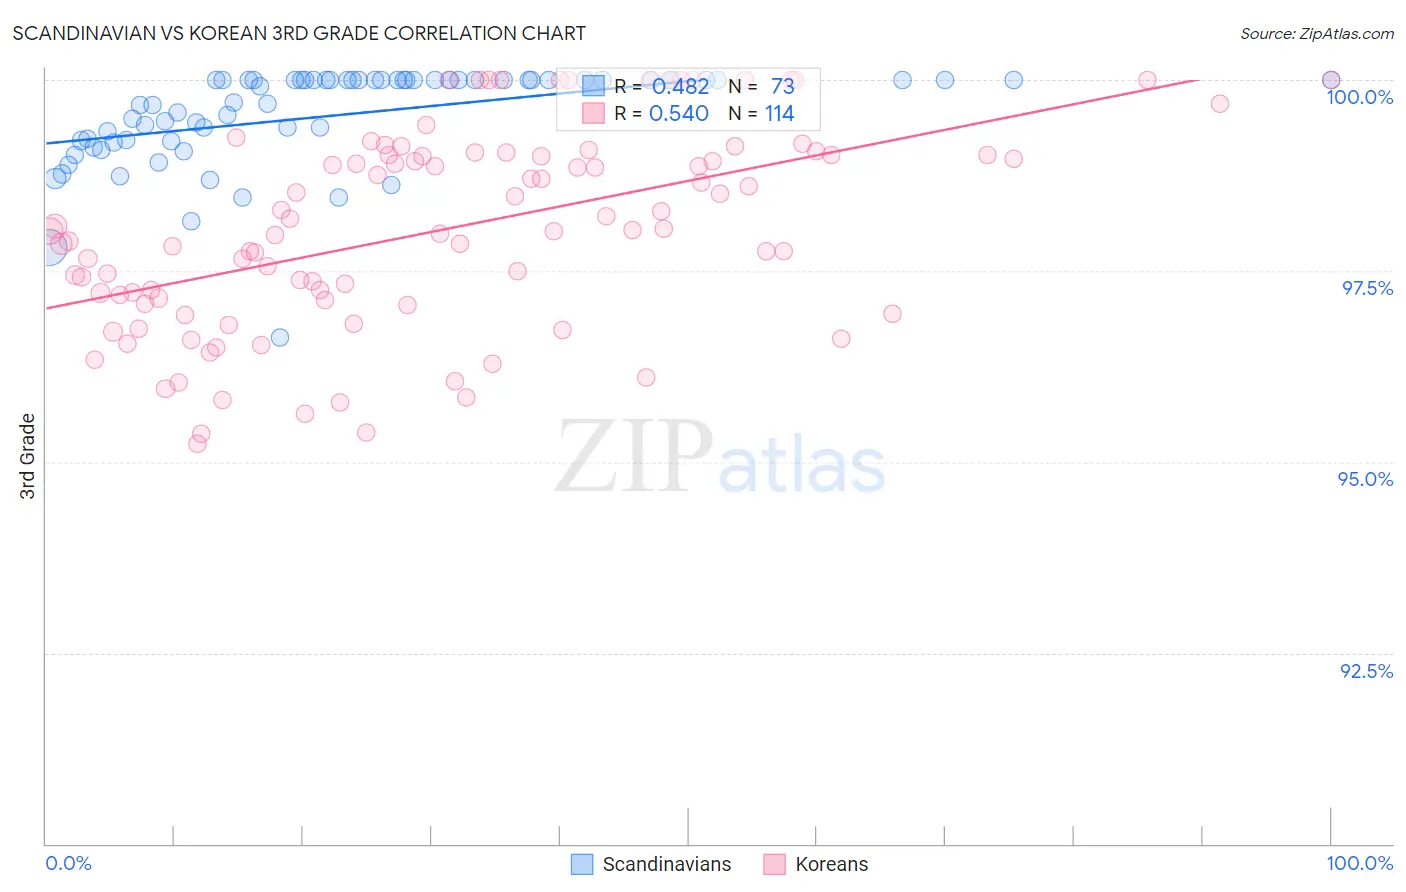
Scandinavian vs Korean 3rd Grade Correlation Chart
The statistical analysis conducted on geographies consisting of 472,660,430 people shows a moderate positive correlation between the proportion of Scandinavians and percentage of population with at least 3rd grade education in the United States with a correlation coefficient (R) of 0.482 and weighted average of 98.4%. Similarly, the statistical analysis conducted on geographies consisting of 510,935,951 people shows a substantial positive correlation between the proportion of Koreans and percentage of population with at least 3rd grade education in the United States with a correlation coefficient (R) of 0.540 and weighted average of 97.4%, a difference of 1.1%.
3rd Grade Correlation Summary
| Measurement | Scandinavian | Korean |
| Minimum | 96.6% | 95.2% |
| Maximum | 100.0% | 100.0% |
| Range | 3.4% | 4.8% |
| Mean | 99.5% | 98.0% |
| Median | 100.0% | 98.0% |
| Interquartile 25% (IQ1) | 99.2% | 97.1% |
| Interquartile 75% (IQ3) | 100.0% | 99.0% |
| Interquartile Range (IQR) | 0.80% | 1.9% |
| Standard Deviation (Sample) | 0.64% | 1.3% |
| Standard Deviation (Population) | 0.64% | 1.3% |
Similar Demographics by 3rd Grade
Demographics Similar to Scandinavians by 3rd Grade
In terms of 3rd grade, the demographic groups most similar to Scandinavians are Czech (98.4%, a difference of 0.0%), French Canadian (98.4%, a difference of 0.010%), European (98.4%, a difference of 0.010%), French (98.4%, a difference of 0.020%), and Chinese (98.4%, a difference of 0.020%).
| Demographics | Rating | Rank | 3rd Grade |
| Scotch-Irish | 100.0 /100 | #25 | Exceptional 98.5% |
| Aleuts | 100.0 /100 | #26 | Exceptional 98.5% |
| Croatians | 100.0 /100 | #27 | Exceptional 98.5% |
| French | 100.0 /100 | #28 | Exceptional 98.4% |
| French Canadians | 100.0 /100 | #29 | Exceptional 98.4% |
| Europeans | 100.0 /100 | #30 | Exceptional 98.4% |
| Czechs | 100.0 /100 | #31 | Exceptional 98.4% |
| Scandinavians | 100.0 /100 | #32 | Exceptional 98.4% |
| Chinese | 100.0 /100 | #33 | Exceptional 98.4% |
| Swiss | 100.0 /100 | #34 | Exceptional 98.4% |
| Arapaho | 100.0 /100 | #35 | Exceptional 98.4% |
| British | 99.9 /100 | #36 | Exceptional 98.4% |
| Italians | 99.9 /100 | #37 | Exceptional 98.4% |
| Chippewa | 99.9 /100 | #38 | Exceptional 98.4% |
| Latvians | 99.9 /100 | #39 | Exceptional 98.4% |
Demographics Similar to Koreans by 3rd Grade
In terms of 3rd grade, the demographic groups most similar to Koreans are U.S. Virgin Islander (97.4%, a difference of 0.0%), Immigrants from Indonesia (97.4%, a difference of 0.0%), Nigerian (97.4%, a difference of 0.010%), Indian (Asian) (97.4%, a difference of 0.010%), and Asian (97.4%, a difference of 0.010%).
| Demographics | Rating | Rank | 3rd Grade |
| Immigrants | Iraq | 1.8 /100 | #235 | Tragic 97.4% |
| Liberians | 1.8 /100 | #236 | Tragic 97.4% |
| Colombians | 1.8 /100 | #237 | Tragic 97.4% |
| Immigrants | Uruguay | 1.7 /100 | #238 | Tragic 97.4% |
| Nigerians | 1.6 /100 | #239 | Tragic 97.4% |
| U.S. Virgin Islanders | 1.4 /100 | #240 | Tragic 97.4% |
| Immigrants | Indonesia | 1.4 /100 | #241 | Tragic 97.4% |
| Koreans | 1.3 /100 | #242 | Tragic 97.4% |
| Indians (Asian) | 1.3 /100 | #243 | Tragic 97.4% |
| Asians | 1.1 /100 | #244 | Tragic 97.4% |
| Ethiopians | 1.1 /100 | #245 | Tragic 97.4% |
| Immigrants | Senegal | 1.0 /100 | #246 | Tragic 97.4% |
| Assyrians/Chaldeans/Syriacs | 1.0 /100 | #247 | Tragic 97.4% |
| Immigrants | Eastern Africa | 0.9 /100 | #248 | Tragic 97.4% |
| South Americans | 0.9 /100 | #249 | Tragic 97.4% |