Samoan vs Colombian Seniors Poverty Over the Age of 65
COMPARE
Samoan
Colombian
Seniors Poverty Over the Age of 65
Seniors Poverty Over the Age of 65 Comparison
Samoans
Colombians
10.0%
SENIORS POVERTY OVER THE AGE OF 65
98.0/ 100
METRIC RATING
70th/ 347
METRIC RANK
12.5%
SENIORS POVERTY OVER THE AGE OF 65
0.2/ 100
METRIC RATING
261st/ 347
METRIC RANK
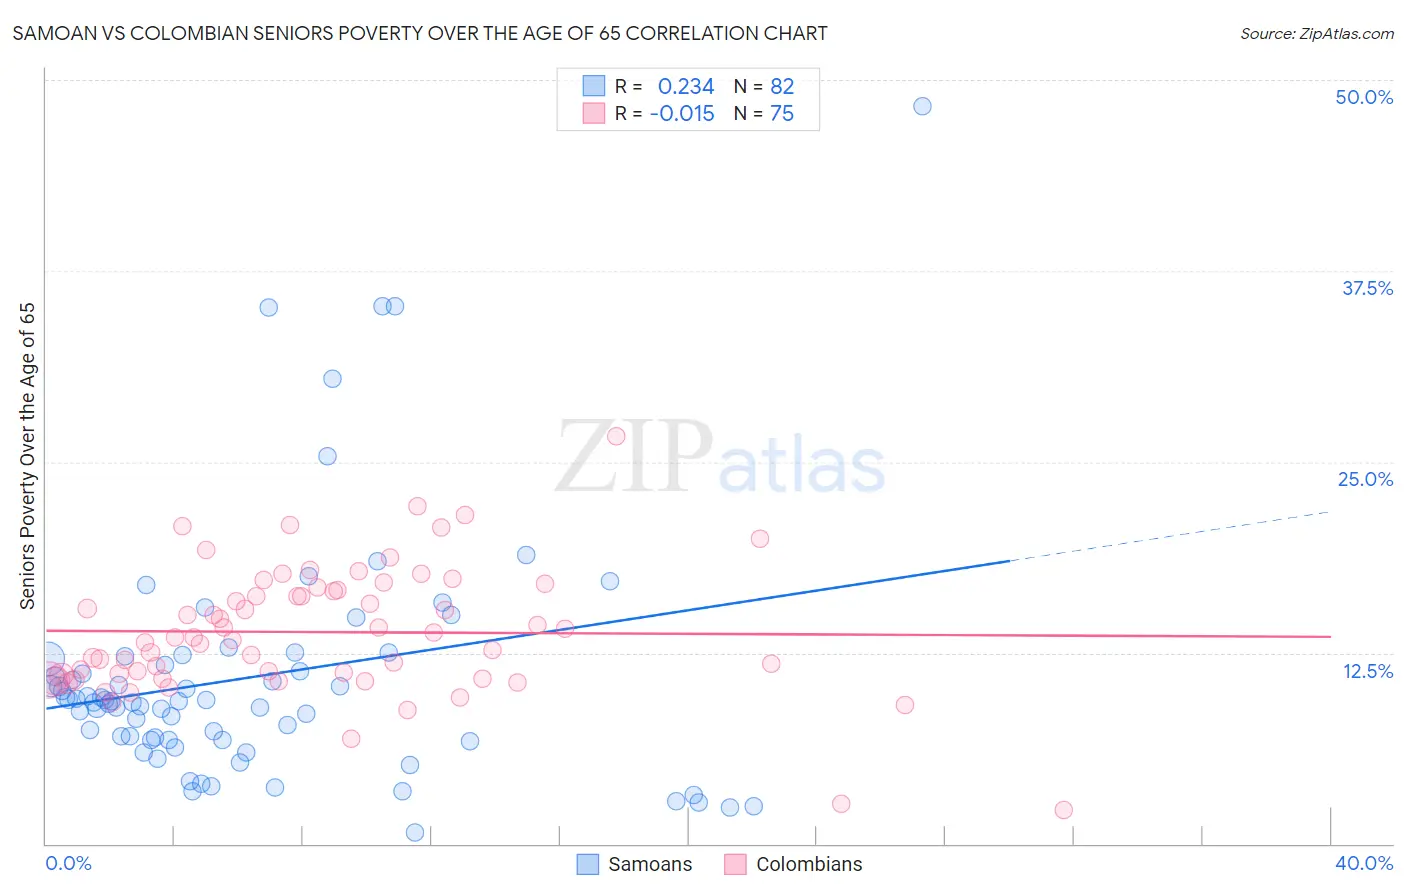
Samoan vs Colombian Seniors Poverty Over the Age of 65 Correlation Chart
The statistical analysis conducted on geographies consisting of 224,422,356 people shows a weak positive correlation between the proportion of Samoans and poverty level among seniors over the age of 65 in the United States with a correlation coefficient (R) of 0.234 and weighted average of 10.0%. Similarly, the statistical analysis conducted on geographies consisting of 417,709,966 people shows no correlation between the proportion of Colombians and poverty level among seniors over the age of 65 in the United States with a correlation coefficient (R) of -0.015 and weighted average of 12.5%, a difference of 25.1%.
Seniors Poverty Over the Age of 65 Correlation Summary
| Measurement | Samoan | Colombian |
| Minimum | 0.73% | 2.2% |
| Maximum | 48.3% | 26.7% |
| Range | 47.5% | 24.4% |
| Mean | 10.9% | 13.9% |
| Median | 9.4% | 13.5% |
| Interquartile 25% (IQ1) | 6.8% | 10.8% |
| Interquartile 75% (IQ3) | 12.1% | 16.6% |
| Interquartile Range (IQR) | 5.3% | 5.8% |
| Standard Deviation (Sample) | 8.0% | 4.2% |
| Standard Deviation (Population) | 8.0% | 4.2% |
Similar Demographics by Seniors Poverty Over the Age of 65
Demographics Similar to Samoans by Seniors Poverty Over the Age of 65
In terms of seniors poverty over the age of 65, the demographic groups most similar to Samoans are Yugoslavian (10.0%, a difference of 0.040%), Palestinian (10.0%, a difference of 0.060%), Russian (10.0%, a difference of 0.090%), Turkish (10.0%, a difference of 0.11%), and Immigrants from Czechoslovakia (10.0%, a difference of 0.20%).
| Demographics | Rating | Rank | Seniors Poverty Over the Age of 65 |
| Macedonians | 98.8 /100 | #63 | Exceptional 9.9% |
| Immigrants | North America | 98.8 /100 | #64 | Exceptional 9.9% |
| Pennsylvania Germans | 98.7 /100 | #65 | Exceptional 9.9% |
| Immigrants | Netherlands | 98.7 /100 | #66 | Exceptional 9.9% |
| Immigrants | Austria | 98.6 /100 | #67 | Exceptional 9.9% |
| Canadians | 98.5 /100 | #68 | Exceptional 9.9% |
| Australians | 98.4 /100 | #69 | Exceptional 9.9% |
| Samoans | 98.0 /100 | #70 | Exceptional 10.0% |
| Yugoslavians | 97.9 /100 | #71 | Exceptional 10.0% |
| Palestinians | 97.9 /100 | #72 | Exceptional 10.0% |
| Russians | 97.9 /100 | #73 | Exceptional 10.0% |
| Turks | 97.9 /100 | #74 | Exceptional 10.0% |
| Immigrants | Czechoslovakia | 97.8 /100 | #75 | Exceptional 10.0% |
| New Zealanders | 97.7 /100 | #76 | Exceptional 10.0% |
| Immigrants | South Africa | 97.7 /100 | #77 | Exceptional 10.0% |
Demographics Similar to Colombians by Seniors Poverty Over the Age of 65
In terms of seniors poverty over the age of 65, the demographic groups most similar to Colombians are Venezuelan (12.5%, a difference of 0.20%), South American (12.5%, a difference of 0.24%), Soviet Union (12.6%, a difference of 0.37%), Inupiat (12.6%, a difference of 0.43%), and Ghanaian (12.4%, a difference of 0.48%).
| Demographics | Rating | Rank | Seniors Poverty Over the Age of 65 |
| Immigrants | Cambodia | 0.3 /100 | #254 | Tragic 12.4% |
| Mexican American Indians | 0.3 /100 | #255 | Tragic 12.4% |
| Immigrants | Panama | 0.2 /100 | #256 | Tragic 12.4% |
| Immigrants | Immigrants | 0.2 /100 | #257 | Tragic 12.4% |
| Dutch West Indians | 0.2 /100 | #258 | Tragic 12.4% |
| Ghanaians | 0.2 /100 | #259 | Tragic 12.4% |
| South Americans | 0.2 /100 | #260 | Tragic 12.5% |
| Colombians | 0.2 /100 | #261 | Tragic 12.5% |
| Venezuelans | 0.1 /100 | #262 | Tragic 12.5% |
| Soviet Union | 0.1 /100 | #263 | Tragic 12.6% |
| Inupiat | 0.1 /100 | #264 | Tragic 12.6% |
| Immigrants | Western Africa | 0.1 /100 | #265 | Tragic 12.6% |
| Africans | 0.1 /100 | #266 | Tragic 12.6% |
| Blackfeet | 0.1 /100 | #267 | Tragic 12.6% |
| Immigrants | Somalia | 0.1 /100 | #268 | Tragic 12.6% |