Samoan vs Blackfeet Single Male Poverty
COMPARE
Samoan
Blackfeet
Single Male Poverty
Single Male Poverty Comparison
Samoans
Blackfeet
11.7%
SINGLE MALE POVERTY
99.9/ 100
METRIC RATING
52nd/ 347
METRIC RANK
15.5%
SINGLE MALE POVERTY
0.0/ 100
METRIC RATING
305th/ 347
METRIC RANK
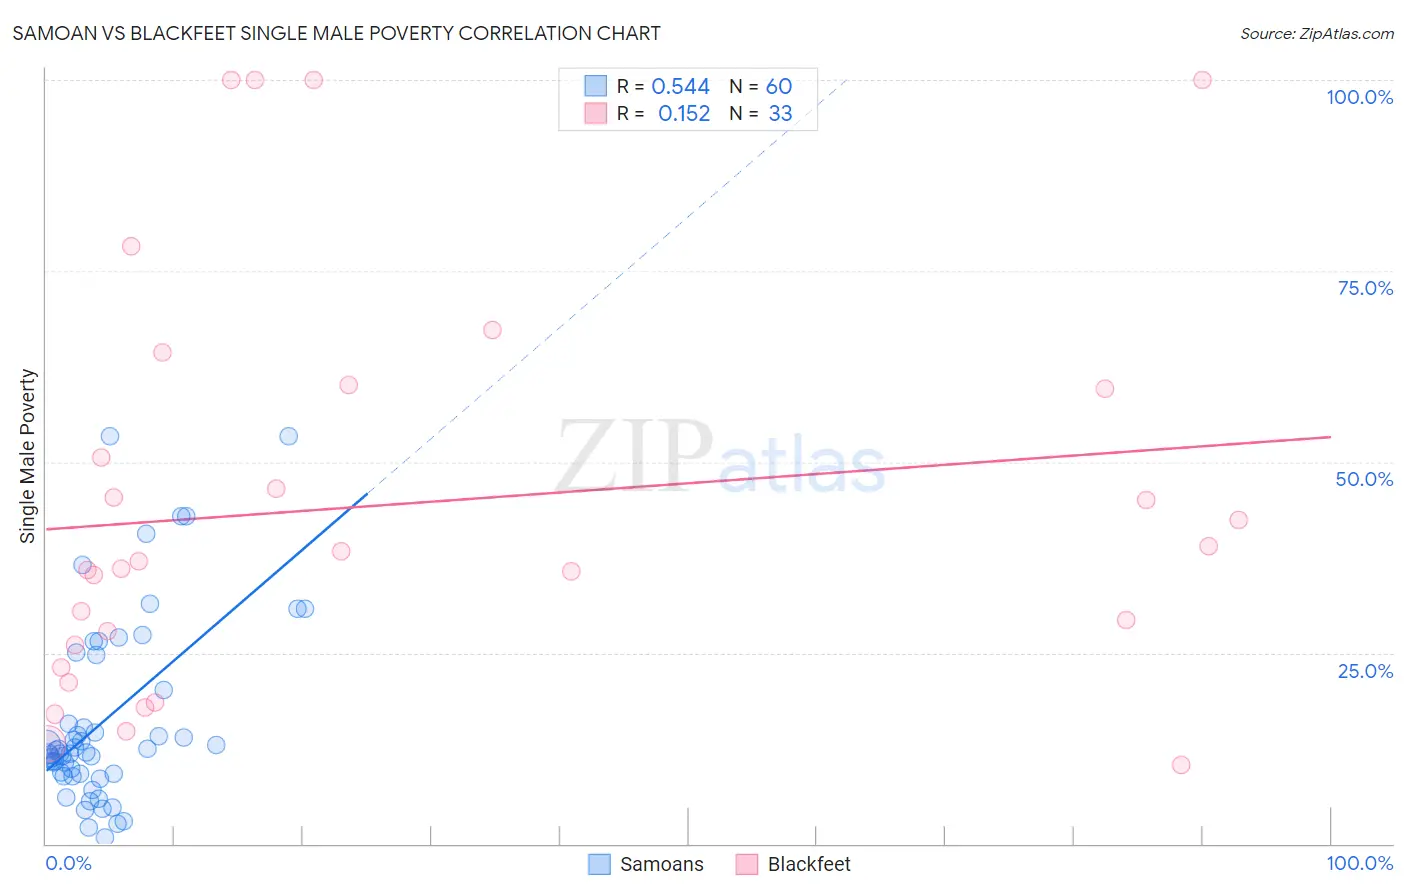
Samoan vs Blackfeet Single Male Poverty Correlation Chart
The statistical analysis conducted on geographies consisting of 211,659,255 people shows a substantial positive correlation between the proportion of Samoans and poverty level among single males in the United States with a correlation coefficient (R) of 0.544 and weighted average of 11.7%. Similarly, the statistical analysis conducted on geographies consisting of 285,257,695 people shows a poor positive correlation between the proportion of Blackfeet and poverty level among single males in the United States with a correlation coefficient (R) of 0.152 and weighted average of 15.5%, a difference of 33.0%.
Single Male Poverty Correlation Summary
| Measurement | Samoan | Blackfeet |
| Minimum | 0.75% | 10.3% |
| Maximum | 53.3% | 100.0% |
| Range | 52.6% | 89.7% |
| Mean | 16.3% | 44.4% |
| Median | 12.1% | 37.0% |
| Interquartile 25% (IQ1) | 9.2% | 24.6% |
| Interquartile 75% (IQ3) | 22.4% | 59.8% |
| Interquartile Range (IQR) | 13.2% | 35.2% |
| Standard Deviation (Sample) | 12.2% | 26.6% |
| Standard Deviation (Population) | 12.1% | 26.1% |
Similar Demographics by Single Male Poverty
Demographics Similar to Samoans by Single Male Poverty
In terms of single male poverty, the demographic groups most similar to Samoans are Bulgarian (11.7%, a difference of 0.10%), Immigrants from Uzbekistan (11.7%, a difference of 0.12%), Cypriot (11.7%, a difference of 0.29%), Paraguayan (11.6%, a difference of 0.31%), and Immigrants from Lithuania (11.6%, a difference of 0.42%).
| Demographics | Rating | Rank | Single Male Poverty |
| Immigrants | Poland | 99.9 /100 | #45 | Exceptional 11.5% |
| Immigrants | Bulgaria | 99.9 /100 | #46 | Exceptional 11.6% |
| Nepalese | 99.9 /100 | #47 | Exceptional 11.6% |
| Immigrants | Indonesia | 99.9 /100 | #48 | Exceptional 11.6% |
| Tlingit-Haida | 99.9 /100 | #49 | Exceptional 11.6% |
| Immigrants | Lithuania | 99.9 /100 | #50 | Exceptional 11.6% |
| Paraguayans | 99.9 /100 | #51 | Exceptional 11.6% |
| Samoans | 99.9 /100 | #52 | Exceptional 11.7% |
| Bulgarians | 99.9 /100 | #53 | Exceptional 11.7% |
| Immigrants | Uzbekistan | 99.9 /100 | #54 | Exceptional 11.7% |
| Cypriots | 99.9 /100 | #55 | Exceptional 11.7% |
| Burmese | 99.8 /100 | #56 | Exceptional 11.7% |
| Immigrants | Romania | 99.8 /100 | #57 | Exceptional 11.7% |
| Immigrants | Brazil | 99.8 /100 | #58 | Exceptional 11.7% |
| Brazilians | 99.8 /100 | #59 | Exceptional 11.8% |
Demographics Similar to Blackfeet by Single Male Poverty
In terms of single male poverty, the demographic groups most similar to Blackfeet are Pennsylvania German (15.6%, a difference of 0.43%), Alaska Native (15.4%, a difference of 0.53%), Aleut (15.4%, a difference of 0.64%), Ute (15.7%, a difference of 1.2%), and Alsatian (15.2%, a difference of 1.7%).
| Demographics | Rating | Rank | Single Male Poverty |
| French American Indians | 0.0 /100 | #298 | Tragic 15.0% |
| Delaware | 0.0 /100 | #299 | Tragic 15.0% |
| Cree | 0.0 /100 | #300 | Tragic 15.1% |
| Dominicans | 0.0 /100 | #301 | Tragic 15.2% |
| Alsatians | 0.0 /100 | #302 | Tragic 15.2% |
| Aleuts | 0.0 /100 | #303 | Tragic 15.4% |
| Alaska Natives | 0.0 /100 | #304 | Tragic 15.4% |
| Blackfeet | 0.0 /100 | #305 | Tragic 15.5% |
| Pennsylvania Germans | 0.0 /100 | #306 | Tragic 15.6% |
| Ute | 0.0 /100 | #307 | Tragic 15.7% |
| Potawatomi | 0.0 /100 | #308 | Tragic 15.8% |
| Americans | 0.0 /100 | #309 | Tragic 15.8% |
| Yakama | 0.0 /100 | #310 | Tragic 15.9% |
| Seminole | 0.0 /100 | #311 | Tragic 16.0% |
| Comanche | 0.0 /100 | #312 | Tragic 16.0% |