Mexican vs Blackfeet Single Male Poverty
COMPARE
Mexican
Blackfeet
Single Male Poverty
Single Male Poverty Comparison
Mexicans
Blackfeet
14.0%
SINGLE MALE POVERTY
0.1/ 100
METRIC RATING
272nd/ 347
METRIC RANK
15.5%
SINGLE MALE POVERTY
0.0/ 100
METRIC RATING
305th/ 347
METRIC RANK
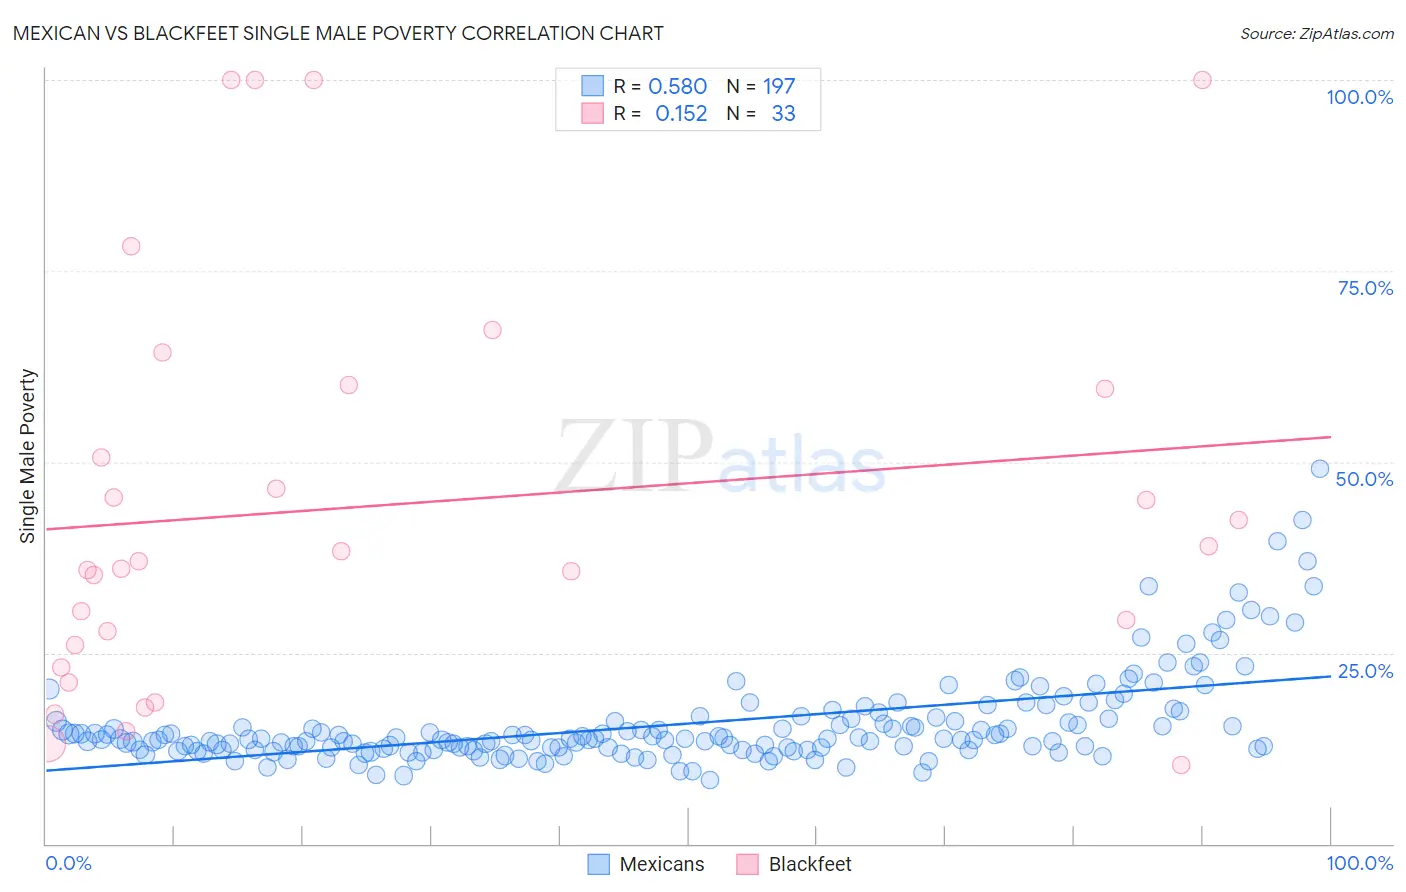
Mexican vs Blackfeet Single Male Poverty Correlation Chart
The statistical analysis conducted on geographies consisting of 471,672,286 people shows a substantial positive correlation between the proportion of Mexicans and poverty level among single males in the United States with a correlation coefficient (R) of 0.580 and weighted average of 14.0%. Similarly, the statistical analysis conducted on geographies consisting of 285,257,695 people shows a poor positive correlation between the proportion of Blackfeet and poverty level among single males in the United States with a correlation coefficient (R) of 0.152 and weighted average of 15.5%, a difference of 10.8%.
Single Male Poverty Correlation Summary
| Measurement | Mexican | Blackfeet |
| Minimum | 8.4% | 10.3% |
| Maximum | 49.1% | 100.0% |
| Range | 40.7% | 89.7% |
| Mean | 15.6% | 44.4% |
| Median | 13.7% | 37.0% |
| Interquartile 25% (IQ1) | 12.3% | 24.6% |
| Interquartile 75% (IQ3) | 16.2% | 59.8% |
| Interquartile Range (IQR) | 3.9% | 35.2% |
| Standard Deviation (Sample) | 6.1% | 26.6% |
| Standard Deviation (Population) | 6.1% | 26.1% |
Similar Demographics by Single Male Poverty
Demographics Similar to Mexicans by Single Male Poverty
In terms of single male poverty, the demographic groups most similar to Mexicans are Irish (14.0%, a difference of 0.060%), Immigrants from Saudi Arabia (14.0%, a difference of 0.090%), Scottish (14.0%, a difference of 0.10%), Immigrants from Mexico (13.9%, a difference of 0.26%), and German (13.9%, a difference of 0.33%).
| Demographics | Rating | Rank | Single Male Poverty |
| Immigrants | Congo | 0.2 /100 | #265 | Tragic 13.9% |
| Immigrants | Cabo Verde | 0.1 /100 | #266 | Tragic 13.9% |
| Germans | 0.1 /100 | #267 | Tragic 13.9% |
| Immigrants | Mexico | 0.1 /100 | #268 | Tragic 13.9% |
| Scottish | 0.1 /100 | #269 | Tragic 14.0% |
| Immigrants | Saudi Arabia | 0.1 /100 | #270 | Tragic 14.0% |
| Irish | 0.1 /100 | #271 | Tragic 14.0% |
| Mexicans | 0.1 /100 | #272 | Tragic 14.0% |
| Welsh | 0.1 /100 | #273 | Tragic 14.0% |
| Hondurans | 0.1 /100 | #274 | Tragic 14.0% |
| English | 0.1 /100 | #275 | Tragic 14.1% |
| Dutch | 0.1 /100 | #276 | Tragic 14.1% |
| Immigrants | Honduras | 0.0 /100 | #277 | Tragic 14.1% |
| Slovaks | 0.0 /100 | #278 | Tragic 14.1% |
| Indonesians | 0.0 /100 | #279 | Tragic 14.1% |
Demographics Similar to Blackfeet by Single Male Poverty
In terms of single male poverty, the demographic groups most similar to Blackfeet are Pennsylvania German (15.6%, a difference of 0.43%), Alaska Native (15.4%, a difference of 0.53%), Aleut (15.4%, a difference of 0.64%), Ute (15.7%, a difference of 1.2%), and Alsatian (15.2%, a difference of 1.7%).
| Demographics | Rating | Rank | Single Male Poverty |
| French American Indians | 0.0 /100 | #298 | Tragic 15.0% |
| Delaware | 0.0 /100 | #299 | Tragic 15.0% |
| Cree | 0.0 /100 | #300 | Tragic 15.1% |
| Dominicans | 0.0 /100 | #301 | Tragic 15.2% |
| Alsatians | 0.0 /100 | #302 | Tragic 15.2% |
| Aleuts | 0.0 /100 | #303 | Tragic 15.4% |
| Alaska Natives | 0.0 /100 | #304 | Tragic 15.4% |
| Blackfeet | 0.0 /100 | #305 | Tragic 15.5% |
| Pennsylvania Germans | 0.0 /100 | #306 | Tragic 15.6% |
| Ute | 0.0 /100 | #307 | Tragic 15.7% |
| Potawatomi | 0.0 /100 | #308 | Tragic 15.8% |
| Americans | 0.0 /100 | #309 | Tragic 15.8% |
| Yakama | 0.0 /100 | #310 | Tragic 15.9% |
| Seminole | 0.0 /100 | #311 | Tragic 16.0% |
| Comanche | 0.0 /100 | #312 | Tragic 16.0% |