Cherokee vs Tsimshian Female Poverty Among 18-24 Year Olds
COMPARE
Cherokee
Tsimshian
Female Poverty Among 18-24 Year Olds
Female Poverty Among 18-24 Year Olds Comparison
Cherokee
Tsimshian
22.7%
FEMALE POVERTY AMONG 18-24 YEAR OLDS
0.0/ 100
METRIC RATING
299th/ 347
METRIC RANK
21.2%
FEMALE POVERTY AMONG 18-24 YEAR OLDS
1.0/ 100
METRIC RATING
256th/ 347
METRIC RANK
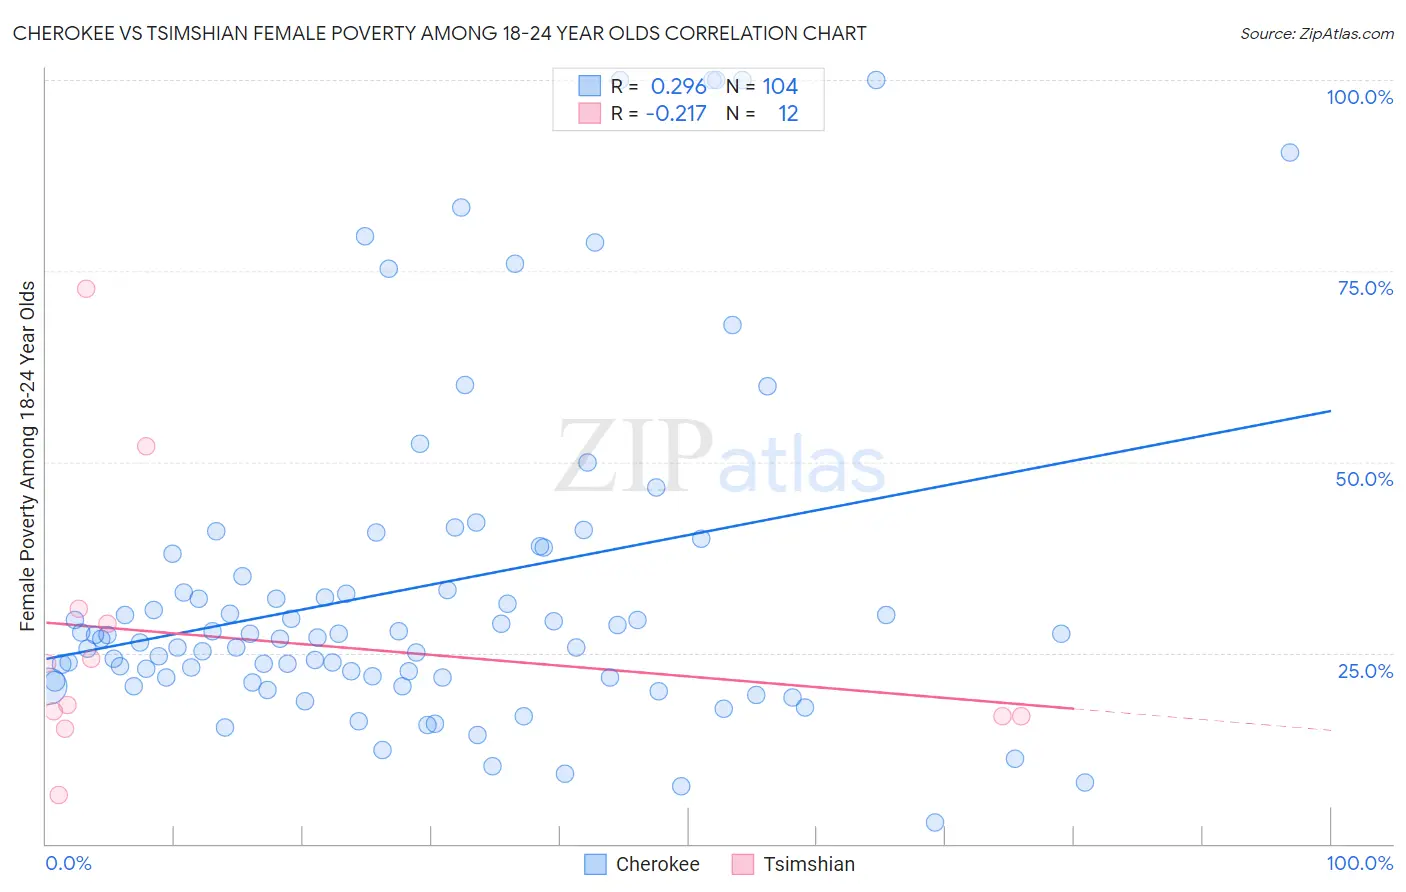
Cherokee vs Tsimshian Female Poverty Among 18-24 Year Olds Correlation Chart
The statistical analysis conducted on geographies consisting of 476,487,682 people shows a weak positive correlation between the proportion of Cherokee and poverty level among females between the ages 18 and 24 in the United States with a correlation coefficient (R) of 0.296 and weighted average of 22.7%. Similarly, the statistical analysis conducted on geographies consisting of 15,547,033 people shows a weak negative correlation between the proportion of Tsimshian and poverty level among females between the ages 18 and 24 in the United States with a correlation coefficient (R) of -0.217 and weighted average of 21.2%, a difference of 6.9%.
Female Poverty Among 18-24 Year Olds Correlation Summary
| Measurement | Cherokee | Tsimshian |
| Minimum | 2.7% | 6.4% |
| Maximum | 100.0% | 72.7% |
| Range | 97.3% | 66.4% |
| Mean | 33.7% | 26.9% |
| Median | 27.2% | 20.9% |
| Interquartile 25% (IQ1) | 21.8% | 16.7% |
| Interquartile 75% (IQ3) | 36.5% | 29.8% |
| Interquartile Range (IQR) | 14.8% | 13.2% |
| Standard Deviation (Sample) | 22.2% | 18.4% |
| Standard Deviation (Population) | 22.1% | 17.6% |
Similar Demographics by Female Poverty Among 18-24 Year Olds
Demographics Similar to Cherokee by Female Poverty Among 18-24 Year Olds
In terms of female poverty among 18-24 year olds, the demographic groups most similar to Cherokee are Central American Indian (22.6%, a difference of 0.41%), Inupiat (22.6%, a difference of 0.47%), Menominee (22.5%, a difference of 0.62%), Shoshone (22.5%, a difference of 0.72%), and African (22.8%, a difference of 0.72%).
| Demographics | Rating | Rank | Female Poverty Among 18-24 Year Olds |
| Alaskan Athabascans | 0.0 /100 | #292 | Tragic 22.5% |
| U.S. Virgin Islanders | 0.0 /100 | #293 | Tragic 22.5% |
| Indonesians | 0.0 /100 | #294 | Tragic 22.5% |
| Shoshone | 0.0 /100 | #295 | Tragic 22.5% |
| Menominee | 0.0 /100 | #296 | Tragic 22.5% |
| Inupiat | 0.0 /100 | #297 | Tragic 22.6% |
| Central American Indians | 0.0 /100 | #298 | Tragic 22.6% |
| Cherokee | 0.0 /100 | #299 | Tragic 22.7% |
| Africans | 0.0 /100 | #300 | Tragic 22.8% |
| Seminole | 0.0 /100 | #301 | Tragic 22.9% |
| Iroquois | 0.0 /100 | #302 | Tragic 22.9% |
| Senegalese | 0.0 /100 | #303 | Tragic 23.0% |
| Sudanese | 0.0 /100 | #304 | Tragic 23.0% |
| Immigrants | Kuwait | 0.0 /100 | #305 | Tragic 23.0% |
| Paiute | 0.0 /100 | #306 | Tragic 23.3% |
Demographics Similar to Tsimshian by Female Poverty Among 18-24 Year Olds
In terms of female poverty among 18-24 year olds, the demographic groups most similar to Tsimshian are Taiwanese (21.2%, a difference of 0.10%), Immigrants from Grenada (21.2%, a difference of 0.15%), British West Indian (21.2%, a difference of 0.18%), Delaware (21.1%, a difference of 0.47%), and South African (21.1%, a difference of 0.52%).
| Demographics | Rating | Rank | Female Poverty Among 18-24 Year Olds |
| Carpatho Rusyns | 2.5 /100 | #249 | Tragic 21.0% |
| Immigrants | West Indies | 2.2 /100 | #250 | Tragic 21.0% |
| West Indians | 1.9 /100 | #251 | Tragic 21.1% |
| South Africans | 1.6 /100 | #252 | Tragic 21.1% |
| Delaware | 1.6 /100 | #253 | Tragic 21.1% |
| British West Indians | 1.2 /100 | #254 | Tragic 21.2% |
| Immigrants | Grenada | 1.2 /100 | #255 | Tragic 21.2% |
| Tsimshian | 1.0 /100 | #256 | Tragic 21.2% |
| Taiwanese | 1.0 /100 | #257 | Tragic 21.2% |
| Vietnamese | 0.6 /100 | #258 | Tragic 21.4% |
| Immigrants | France | 0.6 /100 | #259 | Tragic 21.4% |
| Immigrants | Norway | 0.6 /100 | #260 | Tragic 21.4% |
| Immigrants | Bahamas | 0.5 /100 | #261 | Tragic 21.4% |
| Immigrants | Eastern Africa | 0.4 /100 | #262 | Tragic 21.4% |
| Icelanders | 0.3 /100 | #263 | Tragic 21.5% |