Salvadoran vs Immigrants from North America Female Poverty Among 18-24 Year Olds
COMPARE
Salvadoran
Immigrants from North America
Female Poverty Among 18-24 Year Olds
Female Poverty Among 18-24 Year Olds Comparison
Salvadorans
Immigrants from North America
19.1%
FEMALE POVERTY AMONG 18-24 YEAR OLDS
98.4/ 100
METRIC RATING
97th/ 347
METRIC RANK
19.5%
FEMALE POVERTY AMONG 18-24 YEAR OLDS
92.1/ 100
METRIC RATING
134th/ 347
METRIC RANK
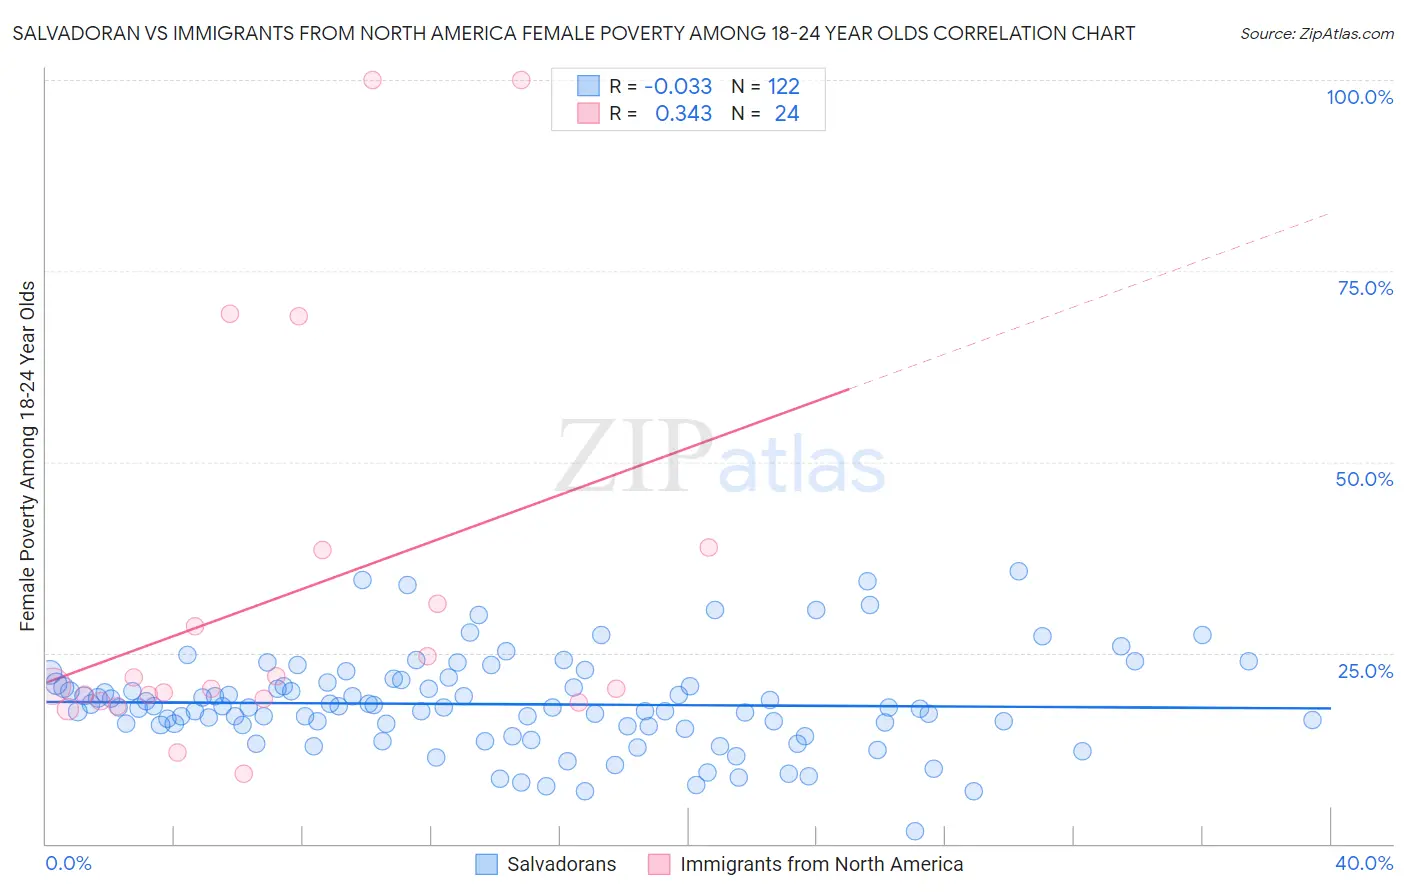
Salvadoran vs Immigrants from North America Female Poverty Among 18-24 Year Olds Correlation Chart
The statistical analysis conducted on geographies consisting of 390,935,430 people shows no correlation between the proportion of Salvadorans and poverty level among females between the ages 18 and 24 in the United States with a correlation coefficient (R) of -0.033 and weighted average of 19.1%. Similarly, the statistical analysis conducted on geographies consisting of 445,818,152 people shows a mild positive correlation between the proportion of Immigrants from North America and poverty level among females between the ages 18 and 24 in the United States with a correlation coefficient (R) of 0.343 and weighted average of 19.5%, a difference of 2.1%.
Female Poverty Among 18-24 Year Olds Correlation Summary
| Measurement | Salvadoran | Immigrants from North America |
| Minimum | 1.7% | 9.1% |
| Maximum | 35.6% | 100.0% |
| Range | 34.0% | 90.9% |
| Mean | 18.3% | 32.3% |
| Median | 17.9% | 20.5% |
| Interquartile 25% (IQ1) | 15.4% | 18.8% |
| Interquartile 75% (IQ3) | 20.9% | 34.9% |
| Interquartile Range (IQR) | 5.5% | 16.1% |
| Standard Deviation (Sample) | 6.2% | 25.6% |
| Standard Deviation (Population) | 6.1% | 25.1% |
Similar Demographics by Female Poverty Among 18-24 Year Olds
Demographics Similar to Salvadorans by Female Poverty Among 18-24 Year Olds
In terms of female poverty among 18-24 year olds, the demographic groups most similar to Salvadorans are Immigrants from Jordan (19.1%, a difference of 0.010%), Immigrants from Czechoslovakia (19.1%, a difference of 0.080%), Chilean (19.1%, a difference of 0.10%), Ecuadorian (19.1%, a difference of 0.19%), and Immigrants from Caribbean (19.1%, a difference of 0.21%).
| Demographics | Rating | Rank | Female Poverty Among 18-24 Year Olds |
| Afghans | 99.0 /100 | #90 | Exceptional 19.0% |
| Romanians | 98.9 /100 | #91 | Exceptional 19.0% |
| Filipinos | 98.9 /100 | #92 | Exceptional 19.0% |
| Haitians | 98.9 /100 | #93 | Exceptional 19.0% |
| Ukrainians | 98.8 /100 | #94 | Exceptional 19.0% |
| Guamanians/Chamorros | 98.8 /100 | #95 | Exceptional 19.0% |
| Sierra Leoneans | 98.7 /100 | #96 | Exceptional 19.0% |
| Salvadorans | 98.4 /100 | #97 | Exceptional 19.1% |
| Immigrants | Jordan | 98.4 /100 | #98 | Exceptional 19.1% |
| Immigrants | Czechoslovakia | 98.3 /100 | #99 | Exceptional 19.1% |
| Chileans | 98.3 /100 | #100 | Exceptional 19.1% |
| Ecuadorians | 98.1 /100 | #101 | Exceptional 19.1% |
| Immigrants | Caribbean | 98.1 /100 | #102 | Exceptional 19.1% |
| Serbians | 98.0 /100 | #103 | Exceptional 19.1% |
| Immigrants | Afghanistan | 98.0 /100 | #104 | Exceptional 19.1% |
Demographics Similar to Immigrants from North America by Female Poverty Among 18-24 Year Olds
In terms of female poverty among 18-24 year olds, the demographic groups most similar to Immigrants from North America are Jamaican (19.5%, a difference of 0.010%), Turkish (19.5%, a difference of 0.010%), Soviet Union (19.5%, a difference of 0.010%), Latvian (19.5%, a difference of 0.11%), and Russian (19.5%, a difference of 0.11%).
| Demographics | Rating | Rank | Female Poverty Among 18-24 Year Olds |
| Cape Verdeans | 93.6 /100 | #127 | Exceptional 19.4% |
| Slovaks | 92.9 /100 | #128 | Exceptional 19.5% |
| Immigrants | England | 92.9 /100 | #129 | Exceptional 19.5% |
| Immigrants | Canada | 92.9 /100 | #130 | Exceptional 19.5% |
| Latvians | 92.7 /100 | #131 | Exceptional 19.5% |
| Jamaicans | 92.1 /100 | #132 | Exceptional 19.5% |
| Turks | 92.1 /100 | #133 | Exceptional 19.5% |
| Immigrants | North America | 92.1 /100 | #134 | Exceptional 19.5% |
| Soviet Union | 92.0 /100 | #135 | Exceptional 19.5% |
| Russians | 91.5 /100 | #136 | Exceptional 19.5% |
| Austrians | 90.7 /100 | #137 | Exceptional 19.5% |
| Immigrants | Morocco | 89.9 /100 | #138 | Excellent 19.6% |
| Indians (Asian) | 88.3 /100 | #139 | Excellent 19.6% |
| Immigrants | Trinidad and Tobago | 85.6 /100 | #140 | Excellent 19.7% |
| Pennsylvania Germans | 85.5 /100 | #141 | Excellent 19.7% |