Immigrants from Russia vs Tsimshian Female Poverty Among 18-24 Year Olds
COMPARE
Immigrants from Russia
Tsimshian
Female Poverty Among 18-24 Year Olds
Female Poverty Among 18-24 Year Olds Comparison
Immigrants from Russia
Tsimshian
19.4%
FEMALE POVERTY AMONG 18-24 YEAR OLDS
93.7/ 100
METRIC RATING
126th/ 347
METRIC RANK
21.2%
FEMALE POVERTY AMONG 18-24 YEAR OLDS
1.0/ 100
METRIC RATING
256th/ 347
METRIC RANK
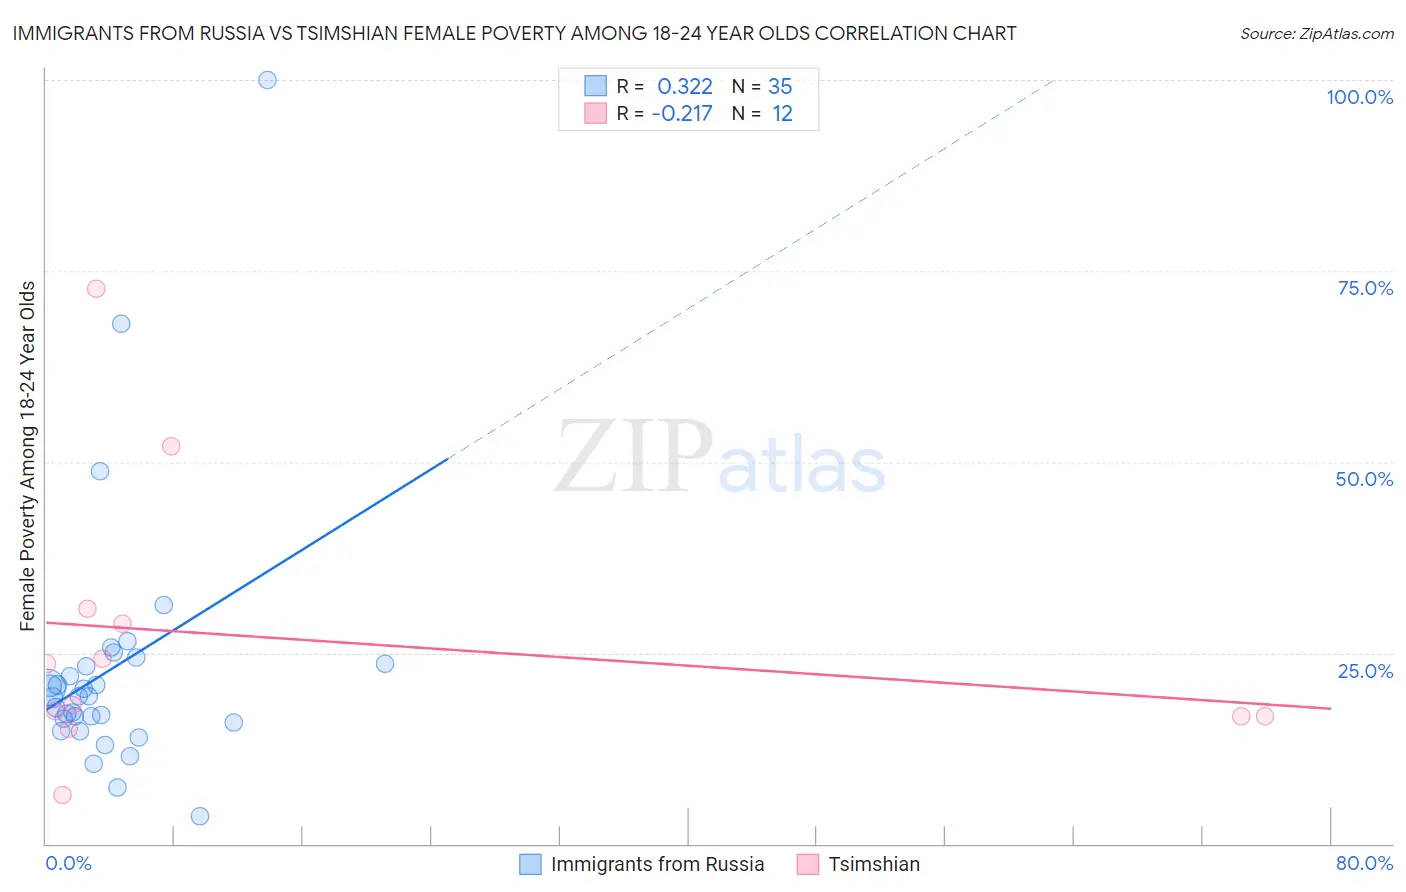
Immigrants from Russia vs Tsimshian Female Poverty Among 18-24 Year Olds Correlation Chart
The statistical analysis conducted on geographies consisting of 339,907,472 people shows a mild positive correlation between the proportion of Immigrants from Russia and poverty level among females between the ages 18 and 24 in the United States with a correlation coefficient (R) of 0.322 and weighted average of 19.4%. Similarly, the statistical analysis conducted on geographies consisting of 15,547,033 people shows a weak negative correlation between the proportion of Tsimshian and poverty level among females between the ages 18 and 24 in the United States with a correlation coefficient (R) of -0.217 and weighted average of 21.2%, a difference of 9.2%.
Female Poverty Among 18-24 Year Olds Correlation Summary
| Measurement | Immigrants from Russia | Tsimshian |
| Minimum | 3.7% | 6.4% |
| Maximum | 100.0% | 72.7% |
| Range | 96.3% | 66.4% |
| Mean | 22.9% | 26.9% |
| Median | 19.3% | 20.9% |
| Interquartile 25% (IQ1) | 15.8% | 16.7% |
| Interquartile 75% (IQ3) | 23.5% | 29.8% |
| Interquartile Range (IQR) | 7.7% | 13.2% |
| Standard Deviation (Sample) | 17.4% | 18.4% |
| Standard Deviation (Population) | 17.2% | 17.6% |
Similar Demographics by Female Poverty Among 18-24 Year Olds
Demographics Similar to Immigrants from Russia by Female Poverty Among 18-24 Year Olds
In terms of female poverty among 18-24 year olds, the demographic groups most similar to Immigrants from Russia are Cape Verdean (19.4%, a difference of 0.020%), Immigrants from Panama (19.4%, a difference of 0.060%), Immigrants from Chile (19.4%, a difference of 0.13%), Slovak (19.5%, a difference of 0.15%), and Immigrants from England (19.5%, a difference of 0.16%).
| Demographics | Rating | Rank | Female Poverty Among 18-24 Year Olds |
| Cypriots | 95.5 /100 | #119 | Exceptional 19.3% |
| Immigrants | Northern Europe | 95.4 /100 | #120 | Exceptional 19.4% |
| Guyanese | 95.3 /100 | #121 | Exceptional 19.4% |
| Cambodians | 94.6 /100 | #122 | Exceptional 19.4% |
| Paraguayans | 94.6 /100 | #123 | Exceptional 19.4% |
| Immigrants | Chile | 94.3 /100 | #124 | Exceptional 19.4% |
| Immigrants | Panama | 94.0 /100 | #125 | Exceptional 19.4% |
| Immigrants | Russia | 93.7 /100 | #126 | Exceptional 19.4% |
| Cape Verdeans | 93.6 /100 | #127 | Exceptional 19.4% |
| Slovaks | 92.9 /100 | #128 | Exceptional 19.5% |
| Immigrants | England | 92.9 /100 | #129 | Exceptional 19.5% |
| Immigrants | Canada | 92.9 /100 | #130 | Exceptional 19.5% |
| Latvians | 92.7 /100 | #131 | Exceptional 19.5% |
| Jamaicans | 92.1 /100 | #132 | Exceptional 19.5% |
| Turks | 92.1 /100 | #133 | Exceptional 19.5% |
Demographics Similar to Tsimshian by Female Poverty Among 18-24 Year Olds
In terms of female poverty among 18-24 year olds, the demographic groups most similar to Tsimshian are Taiwanese (21.2%, a difference of 0.10%), Immigrants from Grenada (21.2%, a difference of 0.15%), British West Indian (21.2%, a difference of 0.18%), Delaware (21.1%, a difference of 0.47%), and South African (21.1%, a difference of 0.52%).
| Demographics | Rating | Rank | Female Poverty Among 18-24 Year Olds |
| Carpatho Rusyns | 2.5 /100 | #249 | Tragic 21.0% |
| Immigrants | West Indies | 2.2 /100 | #250 | Tragic 21.0% |
| West Indians | 1.9 /100 | #251 | Tragic 21.1% |
| South Africans | 1.6 /100 | #252 | Tragic 21.1% |
| Delaware | 1.6 /100 | #253 | Tragic 21.1% |
| British West Indians | 1.2 /100 | #254 | Tragic 21.2% |
| Immigrants | Grenada | 1.2 /100 | #255 | Tragic 21.2% |
| Tsimshian | 1.0 /100 | #256 | Tragic 21.2% |
| Taiwanese | 1.0 /100 | #257 | Tragic 21.2% |
| Vietnamese | 0.6 /100 | #258 | Tragic 21.4% |
| Immigrants | France | 0.6 /100 | #259 | Tragic 21.4% |
| Immigrants | Norway | 0.6 /100 | #260 | Tragic 21.4% |
| Immigrants | Bahamas | 0.5 /100 | #261 | Tragic 21.4% |
| Immigrants | Eastern Africa | 0.4 /100 | #262 | Tragic 21.4% |
| Icelanders | 0.3 /100 | #263 | Tragic 21.5% |