Alaska Native vs Immigrants from Jordan Receiving Food Stamps
COMPARE
Alaska Native
Immigrants from Jordan
Receiving Food Stamps
Receiving Food Stamps Comparison
Alaska Natives
Immigrants from Jordan
15.6%
RECEIVING FOOD STAMPS
0.0/ 100
METRIC RATING
292nd/ 347
METRIC RANK
10.7%
RECEIVING FOOD STAMPS
92.5/ 100
METRIC RATING
128th/ 347
METRIC RANK
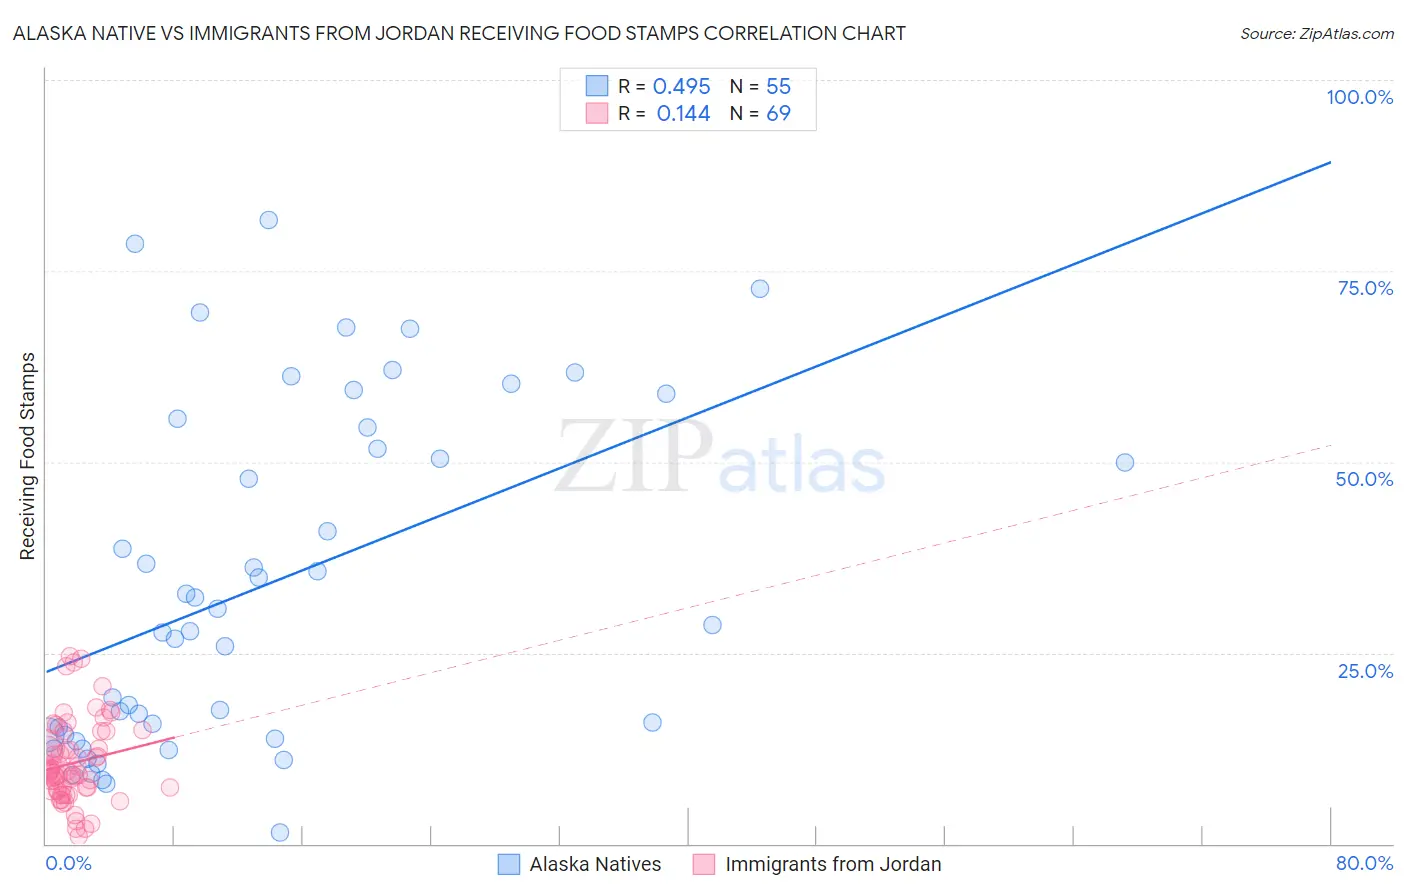
Alaska Native vs Immigrants from Jordan Receiving Food Stamps Correlation Chart
The statistical analysis conducted on geographies consisting of 76,703,689 people shows a moderate positive correlation between the proportion of Alaska Natives and percentage of population receiving government assistance and/or food stamps in the United States with a correlation coefficient (R) of 0.495 and weighted average of 15.6%. Similarly, the statistical analysis conducted on geographies consisting of 181,094,719 people shows a poor positive correlation between the proportion of Immigrants from Jordan and percentage of population receiving government assistance and/or food stamps in the United States with a correlation coefficient (R) of 0.144 and weighted average of 10.7%, a difference of 45.9%.
Receiving Food Stamps Correlation Summary
| Measurement | Alaska Native | Immigrants from Jordan |
| Minimum | 1.5% | 1.0% |
| Maximum | 81.7% | 24.5% |
| Range | 80.2% | 23.5% |
| Mean | 33.9% | 10.6% |
| Median | 28.6% | 9.5% |
| Interquartile 25% (IQ1) | 14.3% | 7.0% |
| Interquartile 75% (IQ3) | 54.5% | 13.7% |
| Interquartile Range (IQR) | 40.2% | 6.7% |
| Standard Deviation (Sample) | 22.1% | 5.3% |
| Standard Deviation (Population) | 21.9% | 5.3% |
Similar Demographics by Receiving Food Stamps
Demographics Similar to Alaska Natives by Receiving Food Stamps
In terms of receiving food stamps, the demographic groups most similar to Alaska Natives are Vietnamese (15.7%, a difference of 0.30%), Immigrants from Latin America (15.7%, a difference of 0.41%), Honduran (15.5%, a difference of 0.44%), Immigrants from Honduras (15.7%, a difference of 0.74%), and Tsimshian (15.7%, a difference of 0.75%).
| Demographics | Rating | Rank | Receiving Food Stamps |
| Immigrants | Liberia | 0.0 /100 | #285 | Tragic 15.1% |
| Africans | 0.0 /100 | #286 | Tragic 15.1% |
| Immigrants | Mexico | 0.0 /100 | #287 | Tragic 15.2% |
| Immigrants | Belize | 0.0 /100 | #288 | Tragic 15.2% |
| Immigrants | Senegal | 0.0 /100 | #289 | Tragic 15.3% |
| Senegalese | 0.0 /100 | #290 | Tragic 15.4% |
| Hondurans | 0.0 /100 | #291 | Tragic 15.5% |
| Alaska Natives | 0.0 /100 | #292 | Tragic 15.6% |
| Vietnamese | 0.0 /100 | #293 | Tragic 15.7% |
| Immigrants | Latin America | 0.0 /100 | #294 | Tragic 15.7% |
| Immigrants | Honduras | 0.0 /100 | #295 | Tragic 15.7% |
| Tsimshian | 0.0 /100 | #296 | Tragic 15.7% |
| Immigrants | Bahamas | 0.0 /100 | #297 | Tragic 15.8% |
| Immigrants | Trinidad and Tobago | 0.0 /100 | #298 | Tragic 15.8% |
| Hispanics or Latinos | 0.0 /100 | #299 | Tragic 15.8% |
Demographics Similar to Immigrants from Jordan by Receiving Food Stamps
In terms of receiving food stamps, the demographic groups most similar to Immigrants from Jordan are Yugoslavian (10.7%, a difference of 0.0%), Immigrants from Ethiopia (10.7%, a difference of 0.010%), Afghan (10.7%, a difference of 0.030%), Israeli (10.7%, a difference of 0.10%), and French (10.7%, a difference of 0.10%).
| Demographics | Rating | Rank | Receiving Food Stamps |
| Slavs | 93.8 /100 | #121 | Exceptional 10.6% |
| Sri Lankans | 93.7 /100 | #122 | Exceptional 10.6% |
| Immigrants | Philippines | 93.3 /100 | #123 | Exceptional 10.7% |
| Paraguayans | 93.0 /100 | #124 | Exceptional 10.7% |
| Ukrainians | 92.8 /100 | #125 | Exceptional 10.7% |
| Afghans | 92.6 /100 | #126 | Exceptional 10.7% |
| Immigrants | Ethiopia | 92.6 /100 | #127 | Exceptional 10.7% |
| Immigrants | Jordan | 92.5 /100 | #128 | Exceptional 10.7% |
| Yugoslavians | 92.5 /100 | #129 | Exceptional 10.7% |
| Israelis | 92.4 /100 | #130 | Exceptional 10.7% |
| French | 92.3 /100 | #131 | Exceptional 10.7% |
| Immigrants | Germany | 92.0 /100 | #132 | Exceptional 10.7% |
| Immigrants | Russia | 90.9 /100 | #133 | Exceptional 10.8% |
| Immigrants | Brazil | 90.3 /100 | #134 | Exceptional 10.8% |
| Argentineans | 90.2 /100 | #135 | Exceptional 10.8% |