Romanian vs Immigrants from Egypt Female Poverty Among 18-24 Year Olds
COMPARE
Romanian
Immigrants from Egypt
Female Poverty Among 18-24 Year Olds
Female Poverty Among 18-24 Year Olds Comparison
Romanians
Immigrants from Egypt
19.0%
FEMALE POVERTY AMONG 18-24 YEAR OLDS
98.9/ 100
METRIC RATING
91st/ 347
METRIC RANK
18.4%
FEMALE POVERTY AMONG 18-24 YEAR OLDS
99.9/ 100
METRIC RATING
54th/ 347
METRIC RANK
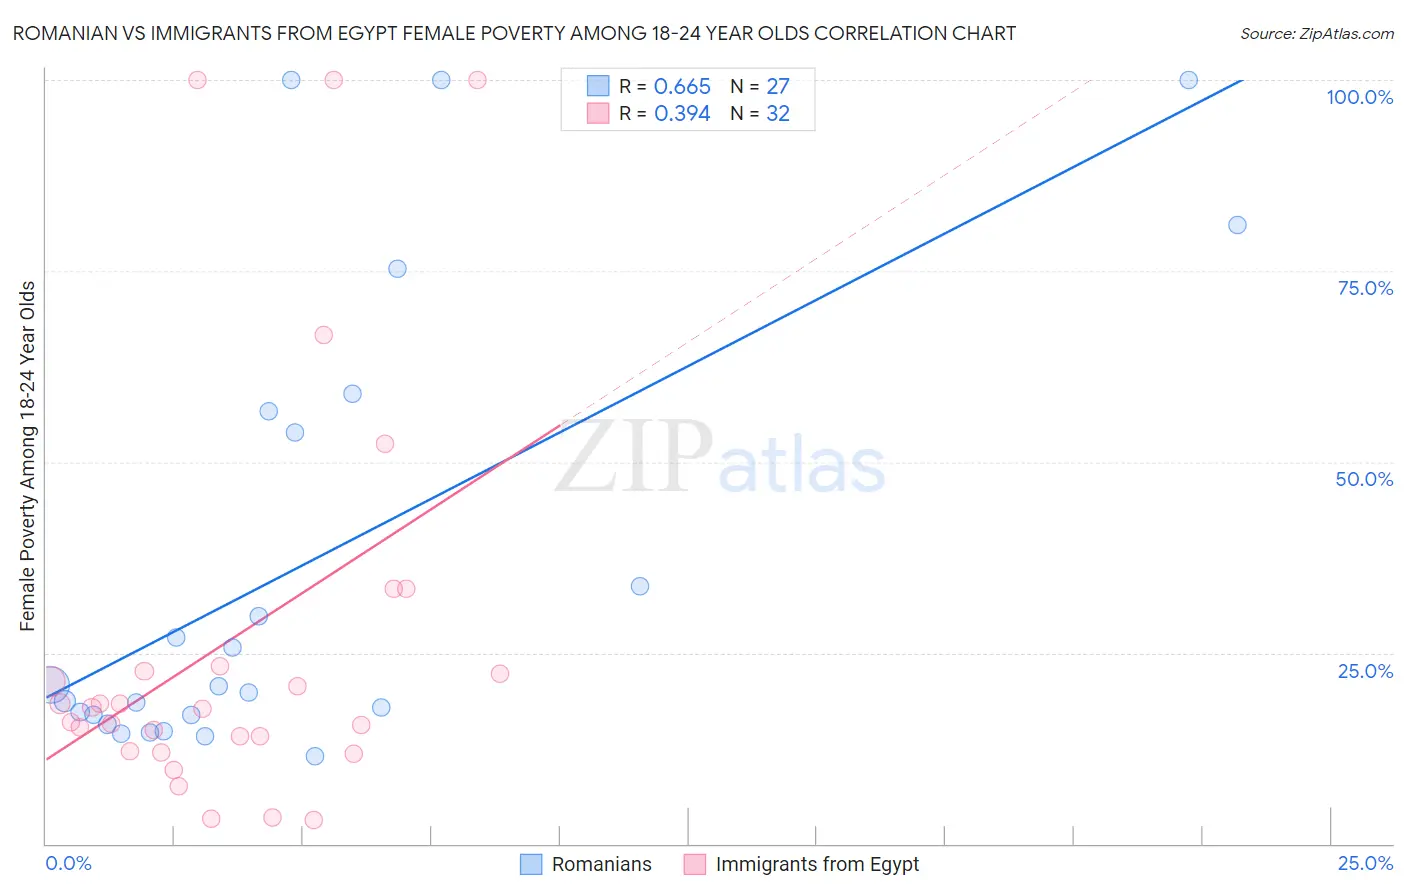
Romanian vs Immigrants from Egypt Female Poverty Among 18-24 Year Olds Correlation Chart
The statistical analysis conducted on geographies consisting of 367,156,694 people shows a significant positive correlation between the proportion of Romanians and poverty level among females between the ages 18 and 24 in the United States with a correlation coefficient (R) of 0.665 and weighted average of 19.0%. Similarly, the statistical analysis conducted on geographies consisting of 241,711,219 people shows a mild positive correlation between the proportion of Immigrants from Egypt and poverty level among females between the ages 18 and 24 in the United States with a correlation coefficient (R) of 0.394 and weighted average of 18.4%, a difference of 3.4%.
Female Poverty Among 18-24 Year Olds Correlation Summary
| Measurement | Romanian | Immigrants from Egypt |
| Minimum | 11.4% | 3.1% |
| Maximum | 100.0% | 100.0% |
| Range | 88.6% | 96.9% |
| Mean | 36.8% | 26.7% |
| Median | 20.7% | 17.8% |
| Interquartile 25% (IQ1) | 16.8% | 13.1% |
| Interquartile 75% (IQ3) | 56.7% | 22.9% |
| Interquartile Range (IQR) | 39.9% | 9.9% |
| Standard Deviation (Sample) | 29.7% | 27.2% |
| Standard Deviation (Population) | 29.2% | 26.7% |
Similar Demographics by Female Poverty Among 18-24 Year Olds
Demographics Similar to Romanians by Female Poverty Among 18-24 Year Olds
In terms of female poverty among 18-24 year olds, the demographic groups most similar to Romanians are Filipino (19.0%, a difference of 0.050%), Haitian (19.0%, a difference of 0.070%), Afghan (19.0%, a difference of 0.090%), Immigrants from Cabo Verde (19.0%, a difference of 0.12%), and Ukrainian (19.0%, a difference of 0.13%).
| Demographics | Rating | Rank | Female Poverty Among 18-24 Year Olds |
| Burmese | 99.2 /100 | #84 | Exceptional 18.9% |
| Immigrants | Armenia | 99.2 /100 | #85 | Exceptional 18.9% |
| Immigrants | Iraq | 99.2 /100 | #86 | Exceptional 18.9% |
| Immigrants | Jamaica | 99.2 /100 | #87 | Exceptional 18.9% |
| Croatians | 99.1 /100 | #88 | Exceptional 19.0% |
| Immigrants | Cabo Verde | 99.0 /100 | #89 | Exceptional 19.0% |
| Afghans | 99.0 /100 | #90 | Exceptional 19.0% |
| Romanians | 98.9 /100 | #91 | Exceptional 19.0% |
| Filipinos | 98.9 /100 | #92 | Exceptional 19.0% |
| Haitians | 98.9 /100 | #93 | Exceptional 19.0% |
| Ukrainians | 98.8 /100 | #94 | Exceptional 19.0% |
| Guamanians/Chamorros | 98.8 /100 | #95 | Exceptional 19.0% |
| Sierra Leoneans | 98.7 /100 | #96 | Exceptional 19.0% |
| Salvadorans | 98.4 /100 | #97 | Exceptional 19.1% |
| Immigrants | Jordan | 98.4 /100 | #98 | Exceptional 19.1% |
Demographics Similar to Immigrants from Egypt by Female Poverty Among 18-24 Year Olds
In terms of female poverty among 18-24 year olds, the demographic groups most similar to Immigrants from Egypt are Albanian (18.4%, a difference of 0.010%), Argentinean (18.4%, a difference of 0.020%), Immigrants from Italy (18.4%, a difference of 0.13%), Immigrants from Ukraine (18.4%, a difference of 0.19%), and Italian (18.3%, a difference of 0.22%).
| Demographics | Rating | Rank | Female Poverty Among 18-24 Year Olds |
| Asians | 100.0 /100 | #47 | Exceptional 18.2% |
| Sri Lankans | 100.0 /100 | #48 | Exceptional 18.2% |
| Bhutanese | 100.0 /100 | #49 | Exceptional 18.2% |
| Samoans | 100.0 /100 | #50 | Exceptional 18.2% |
| Immigrants | Eastern Europe | 99.9 /100 | #51 | Exceptional 18.2% |
| Immigrants | Ireland | 99.9 /100 | #52 | Exceptional 18.3% |
| Italians | 99.9 /100 | #53 | Exceptional 18.3% |
| Immigrants | Egypt | 99.9 /100 | #54 | Exceptional 18.4% |
| Albanians | 99.9 /100 | #55 | Exceptional 18.4% |
| Argentineans | 99.9 /100 | #56 | Exceptional 18.4% |
| Immigrants | Italy | 99.9 /100 | #57 | Exceptional 18.4% |
| Immigrants | Ukraine | 99.9 /100 | #58 | Exceptional 18.4% |
| Egyptians | 99.9 /100 | #59 | Exceptional 18.5% |
| Immigrants | Brazil | 99.8 /100 | #60 | Exceptional 18.5% |
| Immigrants | Albania | 99.8 /100 | #61 | Exceptional 18.5% |