Romanian vs Immigrants from Egypt Family Households
COMPARE
Romanian
Immigrants from Egypt
Family Households
Family Households Comparison
Romanians
Immigrants from Egypt
64.5%
FAMILY HOUSEHOLDS
75.3/ 100
METRIC RATING
150th/ 347
METRIC RANK
65.3%
FAMILY HOUSEHOLDS
99.2/ 100
METRIC RATING
87th/ 347
METRIC RANK
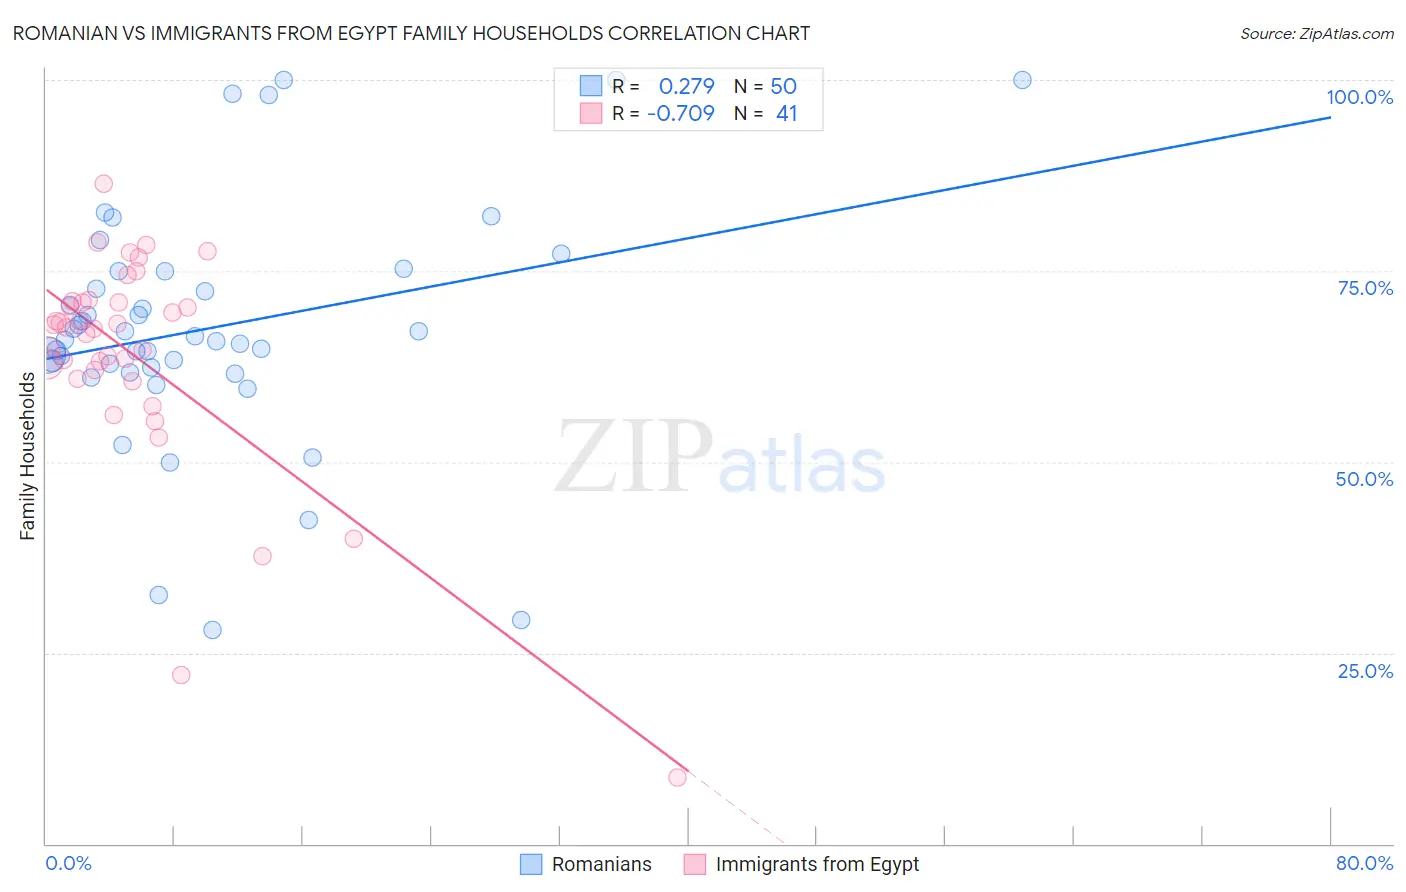
Romanian vs Immigrants from Egypt Family Households Correlation Chart
The statistical analysis conducted on geographies consisting of 377,713,202 people shows a weak positive correlation between the proportion of Romanians and percentage of family households in the United States with a correlation coefficient (R) of 0.279 and weighted average of 64.5%. Similarly, the statistical analysis conducted on geographies consisting of 245,430,680 people shows a strong negative correlation between the proportion of Immigrants from Egypt and percentage of family households in the United States with a correlation coefficient (R) of -0.709 and weighted average of 65.3%, a difference of 1.3%.
Family Households Correlation Summary
| Measurement | Romanian | Immigrants from Egypt |
| Minimum | 27.9% | 8.7% |
| Maximum | 100.0% | 86.5% |
| Range | 72.1% | 77.8% |
| Mean | 67.6% | 64.0% |
| Median | 66.2% | 67.6% |
| Interquartile 25% (IQ1) | 62.4% | 61.5% |
| Interquartile 75% (IQ3) | 74.9% | 71.0% |
| Interquartile Range (IQR) | 12.4% | 9.5% |
| Standard Deviation (Sample) | 15.8% | 14.6% |
| Standard Deviation (Population) | 15.7% | 14.4% |
Similar Demographics by Family Households
Demographics Similar to Romanians by Family Households
In terms of family households, the demographic groups most similar to Romanians are Syrian (64.5%, a difference of 0.0%), Immigrants from Chile (64.6%, a difference of 0.020%), Delaware (64.6%, a difference of 0.020%), Sioux (64.6%, a difference of 0.020%), and Immigrants from Romania (64.6%, a difference of 0.030%).
| Demographics | Rating | Rank | Family Households |
| Czechoslovakians | 82.1 /100 | #143 | Excellent 64.6% |
| South American Indians | 81.9 /100 | #144 | Excellent 64.6% |
| Welsh | 80.1 /100 | #145 | Excellent 64.6% |
| Immigrants | Romania | 77.0 /100 | #146 | Good 64.6% |
| Immigrants | Chile | 76.5 /100 | #147 | Good 64.6% |
| Delaware | 76.3 /100 | #148 | Good 64.6% |
| Sioux | 76.3 /100 | #149 | Good 64.6% |
| Romanians | 75.3 /100 | #150 | Good 64.5% |
| Syrians | 75.2 /100 | #151 | Good 64.5% |
| Scottish | 70.9 /100 | #152 | Good 64.5% |
| Swedes | 69.8 /100 | #153 | Good 64.5% |
| Austrians | 68.5 /100 | #154 | Good 64.5% |
| Uruguayans | 67.7 /100 | #155 | Good 64.5% |
| Czechs | 67.0 /100 | #156 | Good 64.5% |
| Canadians | 66.6 /100 | #157 | Good 64.4% |
Demographics Similar to Immigrants from Egypt by Family Households
In terms of family households, the demographic groups most similar to Immigrants from Egypt are Immigrants from Haiti (65.3%, a difference of 0.030%), Immigrants from Caribbean (65.3%, a difference of 0.040%), Immigrants from Laos (65.3%, a difference of 0.050%), Egyptian (65.4%, a difference of 0.090%), and Crow (65.3%, a difference of 0.10%).
| Demographics | Rating | Rank | Family Households |
| Puget Sound Salish | 99.8 /100 | #80 | Exceptional 65.6% |
| Jordanians | 99.7 /100 | #81 | Exceptional 65.5% |
| Immigrants | Lebanon | 99.7 /100 | #82 | Exceptional 65.5% |
| Immigrants | Guyana | 99.6 /100 | #83 | Exceptional 65.5% |
| Americans | 99.6 /100 | #84 | Exceptional 65.5% |
| Immigrants | Cambodia | 99.5 /100 | #85 | Exceptional 65.4% |
| Egyptians | 99.4 /100 | #86 | Exceptional 65.4% |
| Immigrants | Egypt | 99.2 /100 | #87 | Exceptional 65.3% |
| Immigrants | Haiti | 99.1 /100 | #88 | Exceptional 65.3% |
| Immigrants | Caribbean | 99.1 /100 | #89 | Exceptional 65.3% |
| Immigrants | Laos | 99.1 /100 | #90 | Exceptional 65.3% |
| Crow | 98.9 /100 | #91 | Exceptional 65.3% |
| Hopi | 98.8 /100 | #92 | Exceptional 65.3% |
| Guyanese | 98.8 /100 | #93 | Exceptional 65.3% |
| Immigrants | Poland | 98.7 /100 | #94 | Exceptional 65.2% |