Romanian vs Delaware Female Poverty Among 18-24 Year Olds
COMPARE
Romanian
Delaware
Female Poverty Among 18-24 Year Olds
Female Poverty Among 18-24 Year Olds Comparison
Romanians
Delaware
19.0%
FEMALE POVERTY AMONG 18-24 YEAR OLDS
98.9/ 100
METRIC RATING
91st/ 347
METRIC RANK
21.1%
FEMALE POVERTY AMONG 18-24 YEAR OLDS
1.6/ 100
METRIC RATING
253rd/ 347
METRIC RANK
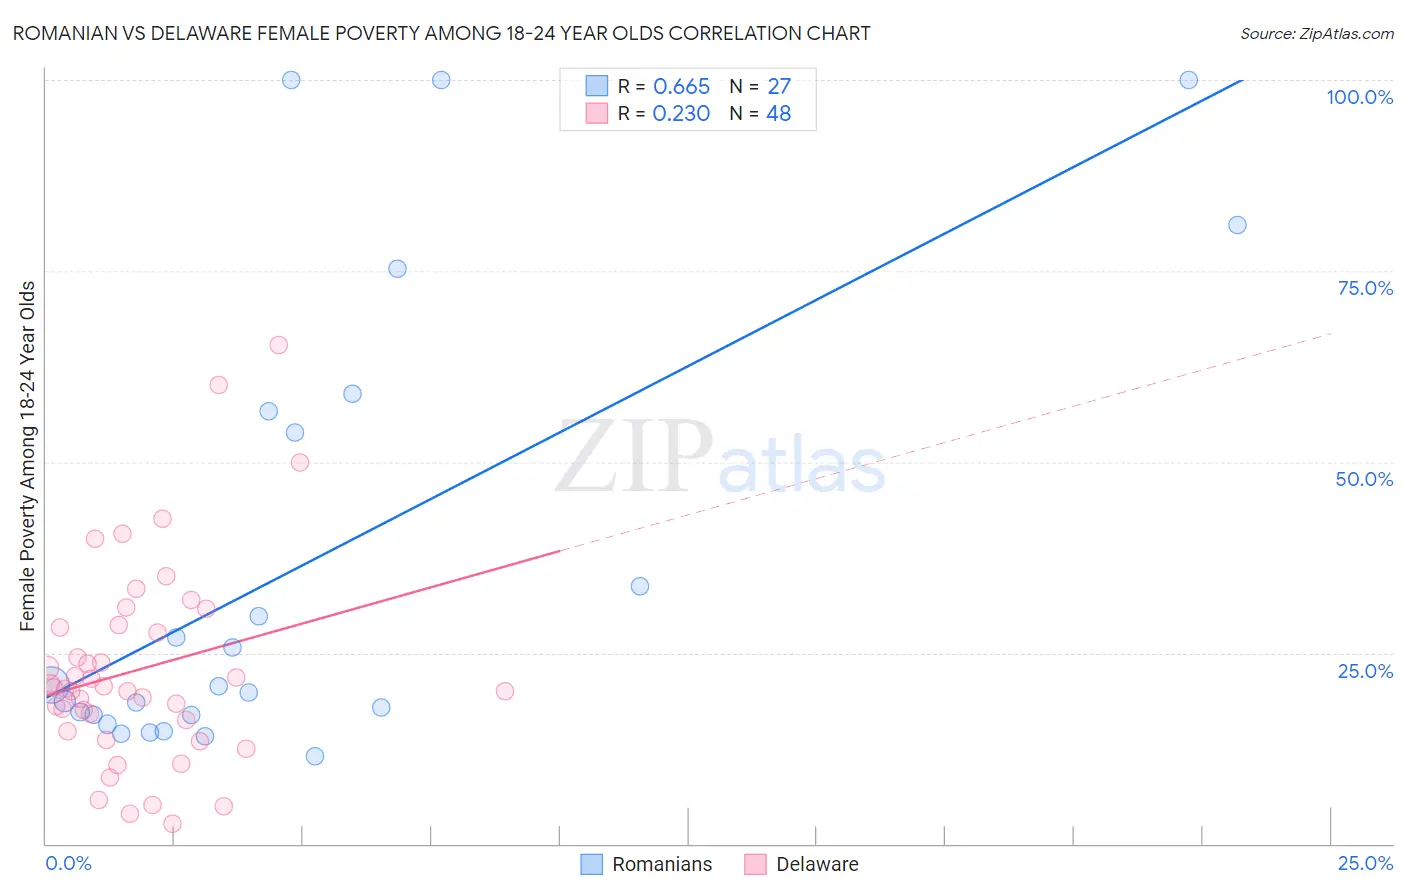
Romanian vs Delaware Female Poverty Among 18-24 Year Olds Correlation Chart
The statistical analysis conducted on geographies consisting of 367,156,694 people shows a significant positive correlation between the proportion of Romanians and poverty level among females between the ages 18 and 24 in the United States with a correlation coefficient (R) of 0.665 and weighted average of 19.0%. Similarly, the statistical analysis conducted on geographies consisting of 95,183,522 people shows a weak positive correlation between the proportion of Delaware and poverty level among females between the ages 18 and 24 in the United States with a correlation coefficient (R) of 0.230 and weighted average of 21.1%, a difference of 11.3%.
Female Poverty Among 18-24 Year Olds Correlation Summary
| Measurement | Romanian | Delaware |
| Minimum | 11.4% | 2.6% |
| Maximum | 100.0% | 65.4% |
| Range | 88.6% | 62.8% |
| Mean | 36.8% | 22.8% |
| Median | 20.7% | 20.4% |
| Interquartile 25% (IQ1) | 16.8% | 15.5% |
| Interquartile 75% (IQ3) | 56.7% | 28.5% |
| Interquartile Range (IQR) | 39.9% | 13.0% |
| Standard Deviation (Sample) | 29.7% | 13.3% |
| Standard Deviation (Population) | 29.2% | 13.1% |
Similar Demographics by Female Poverty Among 18-24 Year Olds
Demographics Similar to Romanians by Female Poverty Among 18-24 Year Olds
In terms of female poverty among 18-24 year olds, the demographic groups most similar to Romanians are Filipino (19.0%, a difference of 0.050%), Haitian (19.0%, a difference of 0.070%), Afghan (19.0%, a difference of 0.090%), Immigrants from Cabo Verde (19.0%, a difference of 0.12%), and Ukrainian (19.0%, a difference of 0.13%).
| Demographics | Rating | Rank | Female Poverty Among 18-24 Year Olds |
| Burmese | 99.2 /100 | #84 | Exceptional 18.9% |
| Immigrants | Armenia | 99.2 /100 | #85 | Exceptional 18.9% |
| Immigrants | Iraq | 99.2 /100 | #86 | Exceptional 18.9% |
| Immigrants | Jamaica | 99.2 /100 | #87 | Exceptional 18.9% |
| Croatians | 99.1 /100 | #88 | Exceptional 19.0% |
| Immigrants | Cabo Verde | 99.0 /100 | #89 | Exceptional 19.0% |
| Afghans | 99.0 /100 | #90 | Exceptional 19.0% |
| Romanians | 98.9 /100 | #91 | Exceptional 19.0% |
| Filipinos | 98.9 /100 | #92 | Exceptional 19.0% |
| Haitians | 98.9 /100 | #93 | Exceptional 19.0% |
| Ukrainians | 98.8 /100 | #94 | Exceptional 19.0% |
| Guamanians/Chamorros | 98.8 /100 | #95 | Exceptional 19.0% |
| Sierra Leoneans | 98.7 /100 | #96 | Exceptional 19.0% |
| Salvadorans | 98.4 /100 | #97 | Exceptional 19.1% |
| Immigrants | Jordan | 98.4 /100 | #98 | Exceptional 19.1% |
Demographics Similar to Delaware by Female Poverty Among 18-24 Year Olds
In terms of female poverty among 18-24 year olds, the demographic groups most similar to Delaware are South African (21.1%, a difference of 0.040%), West Indian (21.1%, a difference of 0.23%), British West Indian (21.2%, a difference of 0.29%), Immigrants from Grenada (21.2%, a difference of 0.32%), and Immigrants from West Indies (21.0%, a difference of 0.43%).
| Demographics | Rating | Rank | Female Poverty Among 18-24 Year Olds |
| Immigrants | Australia | 3.1 /100 | #246 | Tragic 20.9% |
| Immigrants | Africa | 3.0 /100 | #247 | Tragic 21.0% |
| Immigrants | Kenya | 2.5 /100 | #248 | Tragic 21.0% |
| Carpatho Rusyns | 2.5 /100 | #249 | Tragic 21.0% |
| Immigrants | West Indies | 2.2 /100 | #250 | Tragic 21.0% |
| West Indians | 1.9 /100 | #251 | Tragic 21.1% |
| South Africans | 1.6 /100 | #252 | Tragic 21.1% |
| Delaware | 1.6 /100 | #253 | Tragic 21.1% |
| British West Indians | 1.2 /100 | #254 | Tragic 21.2% |
| Immigrants | Grenada | 1.2 /100 | #255 | Tragic 21.2% |
| Tsimshian | 1.0 /100 | #256 | Tragic 21.2% |
| Taiwanese | 1.0 /100 | #257 | Tragic 21.2% |
| Vietnamese | 0.6 /100 | #258 | Tragic 21.4% |
| Immigrants | France | 0.6 /100 | #259 | Tragic 21.4% |
| Immigrants | Norway | 0.6 /100 | #260 | Tragic 21.4% |