Romanian vs Czechoslovakian Female Poverty Among 18-24 Year Olds
COMPARE
Romanian
Czechoslovakian
Female Poverty Among 18-24 Year Olds
Female Poverty Among 18-24 Year Olds Comparison
Romanians
Czechoslovakians
19.0%
FEMALE POVERTY AMONG 18-24 YEAR OLDS
98.9/ 100
METRIC RATING
91st/ 347
METRIC RANK
20.0%
FEMALE POVERTY AMONG 18-24 YEAR OLDS
61.8/ 100
METRIC RATING
167th/ 347
METRIC RANK
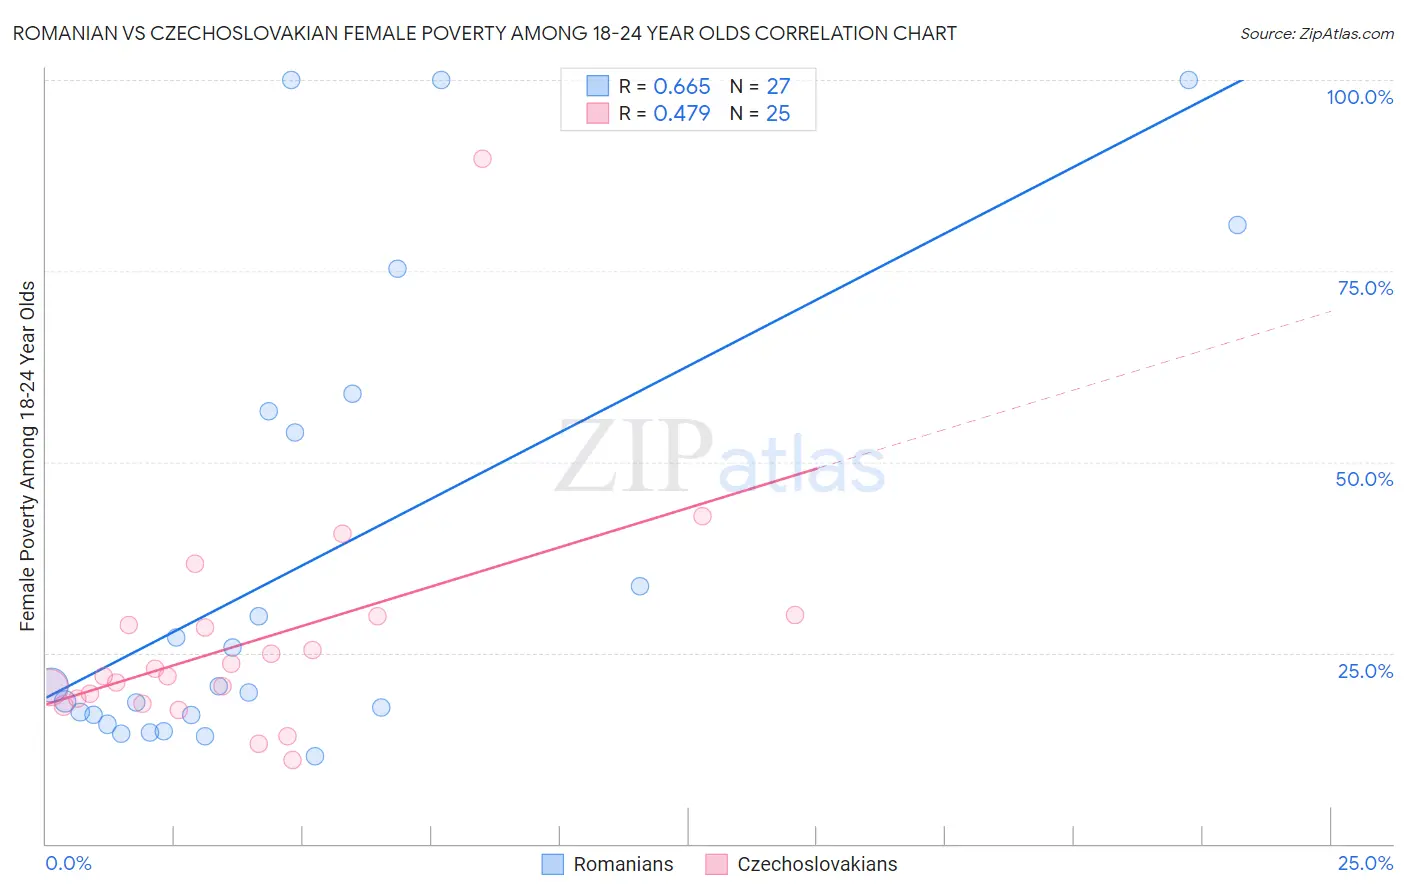
Romanian vs Czechoslovakian Female Poverty Among 18-24 Year Olds Correlation Chart
The statistical analysis conducted on geographies consisting of 367,156,694 people shows a significant positive correlation between the proportion of Romanians and poverty level among females between the ages 18 and 24 in the United States with a correlation coefficient (R) of 0.665 and weighted average of 19.0%. Similarly, the statistical analysis conducted on geographies consisting of 357,520,736 people shows a moderate positive correlation between the proportion of Czechoslovakians and poverty level among females between the ages 18 and 24 in the United States with a correlation coefficient (R) of 0.479 and weighted average of 20.0%, a difference of 5.3%.
Female Poverty Among 18-24 Year Olds Correlation Summary
| Measurement | Romanian | Czechoslovakian |
| Minimum | 11.4% | 11.0% |
| Maximum | 100.0% | 89.7% |
| Range | 88.6% | 78.7% |
| Mean | 36.8% | 26.4% |
| Median | 20.7% | 22.0% |
| Interquartile 25% (IQ1) | 16.8% | 18.6% |
| Interquartile 75% (IQ3) | 56.7% | 29.3% |
| Interquartile Range (IQR) | 39.9% | 10.6% |
| Standard Deviation (Sample) | 29.7% | 15.4% |
| Standard Deviation (Population) | 29.2% | 15.1% |
Similar Demographics by Female Poverty Among 18-24 Year Olds
Demographics Similar to Romanians by Female Poverty Among 18-24 Year Olds
In terms of female poverty among 18-24 year olds, the demographic groups most similar to Romanians are Filipino (19.0%, a difference of 0.050%), Haitian (19.0%, a difference of 0.070%), Afghan (19.0%, a difference of 0.090%), Immigrants from Cabo Verde (19.0%, a difference of 0.12%), and Ukrainian (19.0%, a difference of 0.13%).
| Demographics | Rating | Rank | Female Poverty Among 18-24 Year Olds |
| Burmese | 99.2 /100 | #84 | Exceptional 18.9% |
| Immigrants | Armenia | 99.2 /100 | #85 | Exceptional 18.9% |
| Immigrants | Iraq | 99.2 /100 | #86 | Exceptional 18.9% |
| Immigrants | Jamaica | 99.2 /100 | #87 | Exceptional 18.9% |
| Croatians | 99.1 /100 | #88 | Exceptional 19.0% |
| Immigrants | Cabo Verde | 99.0 /100 | #89 | Exceptional 19.0% |
| Afghans | 99.0 /100 | #90 | Exceptional 19.0% |
| Romanians | 98.9 /100 | #91 | Exceptional 19.0% |
| Filipinos | 98.9 /100 | #92 | Exceptional 19.0% |
| Haitians | 98.9 /100 | #93 | Exceptional 19.0% |
| Ukrainians | 98.8 /100 | #94 | Exceptional 19.0% |
| Guamanians/Chamorros | 98.8 /100 | #95 | Exceptional 19.0% |
| Sierra Leoneans | 98.7 /100 | #96 | Exceptional 19.0% |
| Salvadorans | 98.4 /100 | #97 | Exceptional 19.1% |
| Immigrants | Jordan | 98.4 /100 | #98 | Exceptional 19.1% |
Demographics Similar to Czechoslovakians by Female Poverty Among 18-24 Year Olds
In terms of female poverty among 18-24 year olds, the demographic groups most similar to Czechoslovakians are Fijian (20.0%, a difference of 0.14%), Hmong (20.0%, a difference of 0.32%), Iranian (20.1%, a difference of 0.36%), Immigrants from Nigeria (20.1%, a difference of 0.38%), and Belgian (19.9%, a difference of 0.40%).
| Demographics | Rating | Rank | Female Poverty Among 18-24 Year Olds |
| Pakistanis | 74.1 /100 | #160 | Good 19.8% |
| Immigrants | Belize | 74.1 /100 | #161 | Good 19.8% |
| French Canadians | 73.0 /100 | #162 | Good 19.9% |
| Malaysians | 72.7 /100 | #163 | Good 19.9% |
| Central Americans | 70.0 /100 | #164 | Good 19.9% |
| Eastern Europeans | 69.3 /100 | #165 | Good 19.9% |
| Belgians | 69.1 /100 | #166 | Good 19.9% |
| Czechoslovakians | 61.8 /100 | #167 | Good 20.0% |
| Fijians | 59.1 /100 | #168 | Average 20.0% |
| Hmong | 55.4 /100 | #169 | Average 20.0% |
| Iranians | 54.7 /100 | #170 | Average 20.1% |
| Immigrants | Nigeria | 54.3 /100 | #171 | Average 20.1% |
| Belizeans | 52.0 /100 | #172 | Average 20.1% |
| Irish | 50.0 /100 | #173 | Average 20.1% |
| Swedes | 50.0 /100 | #174 | Average 20.1% |