Comanche vs Immigrants from Egypt Female Poverty Among 18-24 Year Olds
COMPARE
Comanche
Immigrants from Egypt
Female Poverty Among 18-24 Year Olds
Female Poverty Among 18-24 Year Olds Comparison
Comanche
Immigrants from Egypt
23.6%
FEMALE POVERTY AMONG 18-24 YEAR OLDS
0.0/ 100
METRIC RATING
310th/ 347
METRIC RANK
18.4%
FEMALE POVERTY AMONG 18-24 YEAR OLDS
99.9/ 100
METRIC RATING
54th/ 347
METRIC RANK
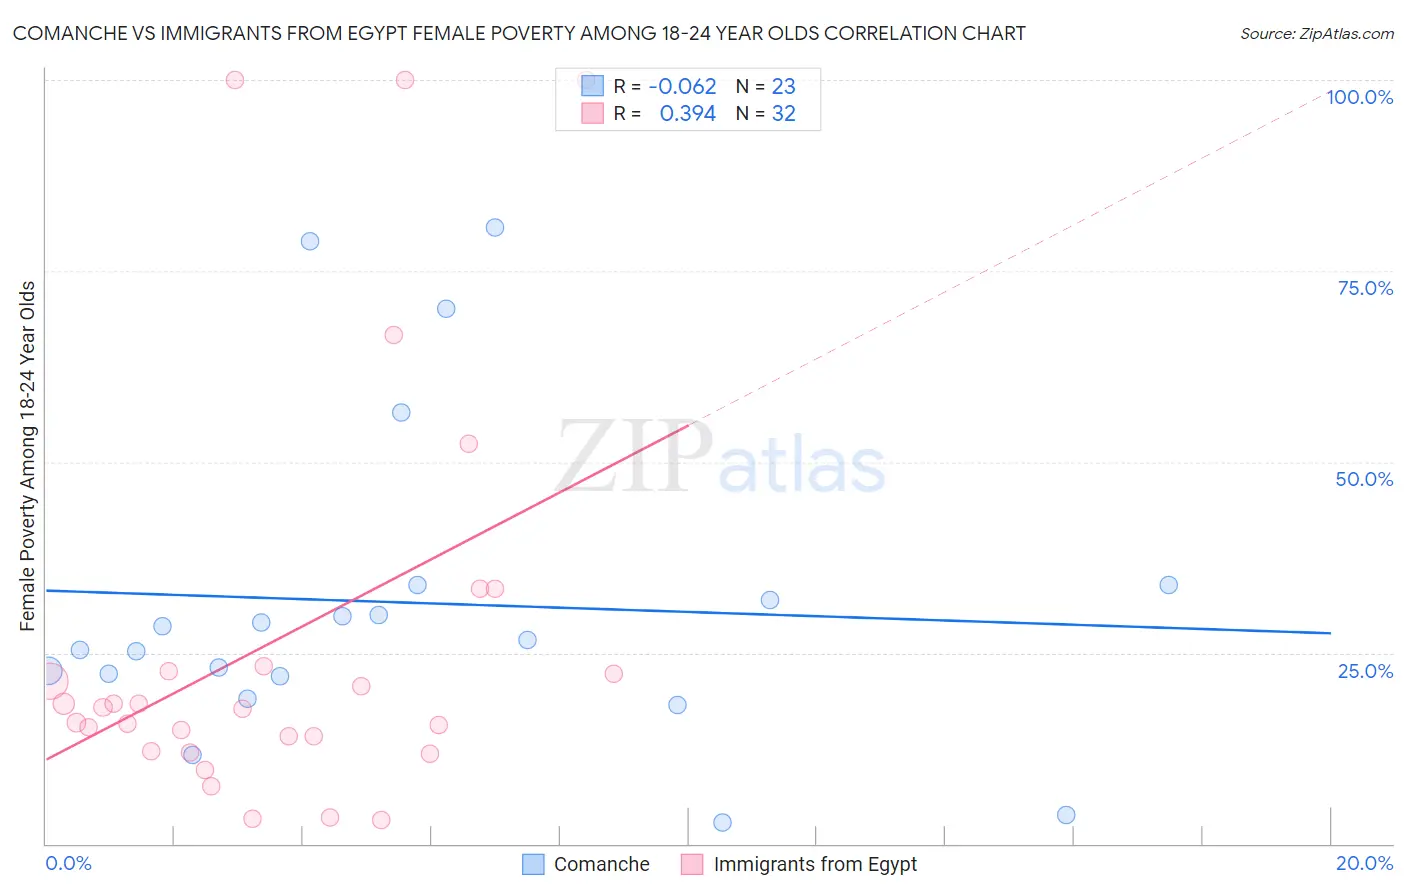
Comanche vs Immigrants from Egypt Female Poverty Among 18-24 Year Olds Correlation Chart
The statistical analysis conducted on geographies consisting of 109,070,377 people shows a slight negative correlation between the proportion of Comanche and poverty level among females between the ages 18 and 24 in the United States with a correlation coefficient (R) of -0.062 and weighted average of 23.6%. Similarly, the statistical analysis conducted on geographies consisting of 241,711,219 people shows a mild positive correlation between the proportion of Immigrants from Egypt and poverty level among females between the ages 18 and 24 in the United States with a correlation coefficient (R) of 0.394 and weighted average of 18.4%, a difference of 28.6%.
Female Poverty Among 18-24 Year Olds Correlation Summary
| Measurement | Comanche | Immigrants from Egypt |
| Minimum | 2.9% | 3.1% |
| Maximum | 80.7% | 100.0% |
| Range | 77.8% | 96.9% |
| Mean | 31.5% | 26.7% |
| Median | 26.7% | 17.8% |
| Interquartile 25% (IQ1) | 21.9% | 13.1% |
| Interquartile 75% (IQ3) | 33.9% | 22.9% |
| Interquartile Range (IQR) | 12.0% | 9.9% |
| Standard Deviation (Sample) | 20.8% | 27.2% |
| Standard Deviation (Population) | 20.4% | 26.7% |
Similar Demographics by Female Poverty Among 18-24 Year Olds
Demographics Similar to Comanche by Female Poverty Among 18-24 Year Olds
In terms of female poverty among 18-24 year olds, the demographic groups most similar to Comanche are Blackfeet (23.6%, a difference of 0.050%), Potawatomi (23.7%, a difference of 0.29%), Immigrants from Sudan (23.5%, a difference of 0.50%), Cree (23.4%, a difference of 0.85%), and Paiute (23.3%, a difference of 1.4%).
| Demographics | Rating | Rank | Female Poverty Among 18-24 Year Olds |
| Senegalese | 0.0 /100 | #303 | Tragic 23.0% |
| Sudanese | 0.0 /100 | #304 | Tragic 23.0% |
| Immigrants | Kuwait | 0.0 /100 | #305 | Tragic 23.0% |
| Paiute | 0.0 /100 | #306 | Tragic 23.3% |
| Cree | 0.0 /100 | #307 | Tragic 23.4% |
| Immigrants | Sudan | 0.0 /100 | #308 | Tragic 23.5% |
| Blackfeet | 0.0 /100 | #309 | Tragic 23.6% |
| Comanche | 0.0 /100 | #310 | Tragic 23.6% |
| Potawatomi | 0.0 /100 | #311 | Tragic 23.7% |
| Yuman | 0.0 /100 | #312 | Tragic 24.0% |
| Creek | 0.0 /100 | #313 | Tragic 24.2% |
| Choctaw | 0.0 /100 | #314 | Tragic 24.3% |
| Blacks/African Americans | 0.0 /100 | #315 | Tragic 24.3% |
| Alsatians | 0.0 /100 | #316 | Tragic 24.4% |
| Osage | 0.0 /100 | #317 | Tragic 24.5% |
Demographics Similar to Immigrants from Egypt by Female Poverty Among 18-24 Year Olds
In terms of female poverty among 18-24 year olds, the demographic groups most similar to Immigrants from Egypt are Albanian (18.4%, a difference of 0.010%), Argentinean (18.4%, a difference of 0.020%), Immigrants from Italy (18.4%, a difference of 0.13%), Immigrants from Ukraine (18.4%, a difference of 0.19%), and Italian (18.3%, a difference of 0.22%).
| Demographics | Rating | Rank | Female Poverty Among 18-24 Year Olds |
| Asians | 100.0 /100 | #47 | Exceptional 18.2% |
| Sri Lankans | 100.0 /100 | #48 | Exceptional 18.2% |
| Bhutanese | 100.0 /100 | #49 | Exceptional 18.2% |
| Samoans | 100.0 /100 | #50 | Exceptional 18.2% |
| Immigrants | Eastern Europe | 99.9 /100 | #51 | Exceptional 18.2% |
| Immigrants | Ireland | 99.9 /100 | #52 | Exceptional 18.3% |
| Italians | 99.9 /100 | #53 | Exceptional 18.3% |
| Immigrants | Egypt | 99.9 /100 | #54 | Exceptional 18.4% |
| Albanians | 99.9 /100 | #55 | Exceptional 18.4% |
| Argentineans | 99.9 /100 | #56 | Exceptional 18.4% |
| Immigrants | Italy | 99.9 /100 | #57 | Exceptional 18.4% |
| Immigrants | Ukraine | 99.9 /100 | #58 | Exceptional 18.4% |
| Egyptians | 99.9 /100 | #59 | Exceptional 18.5% |
| Immigrants | Brazil | 99.8 /100 | #60 | Exceptional 18.5% |
| Immigrants | Albania | 99.8 /100 | #61 | Exceptional 18.5% |