Luxembourger vs Immigrants from Egypt Female Poverty Among 18-24 Year Olds
COMPARE
Luxembourger
Immigrants from Egypt
Female Poverty Among 18-24 Year Olds
Female Poverty Among 18-24 Year Olds Comparison
Luxembourgers
Immigrants from Egypt
20.9%
FEMALE POVERTY AMONG 18-24 YEAR OLDS
4.2/ 100
METRIC RATING
240th/ 347
METRIC RANK
18.4%
FEMALE POVERTY AMONG 18-24 YEAR OLDS
99.9/ 100
METRIC RATING
54th/ 347
METRIC RANK
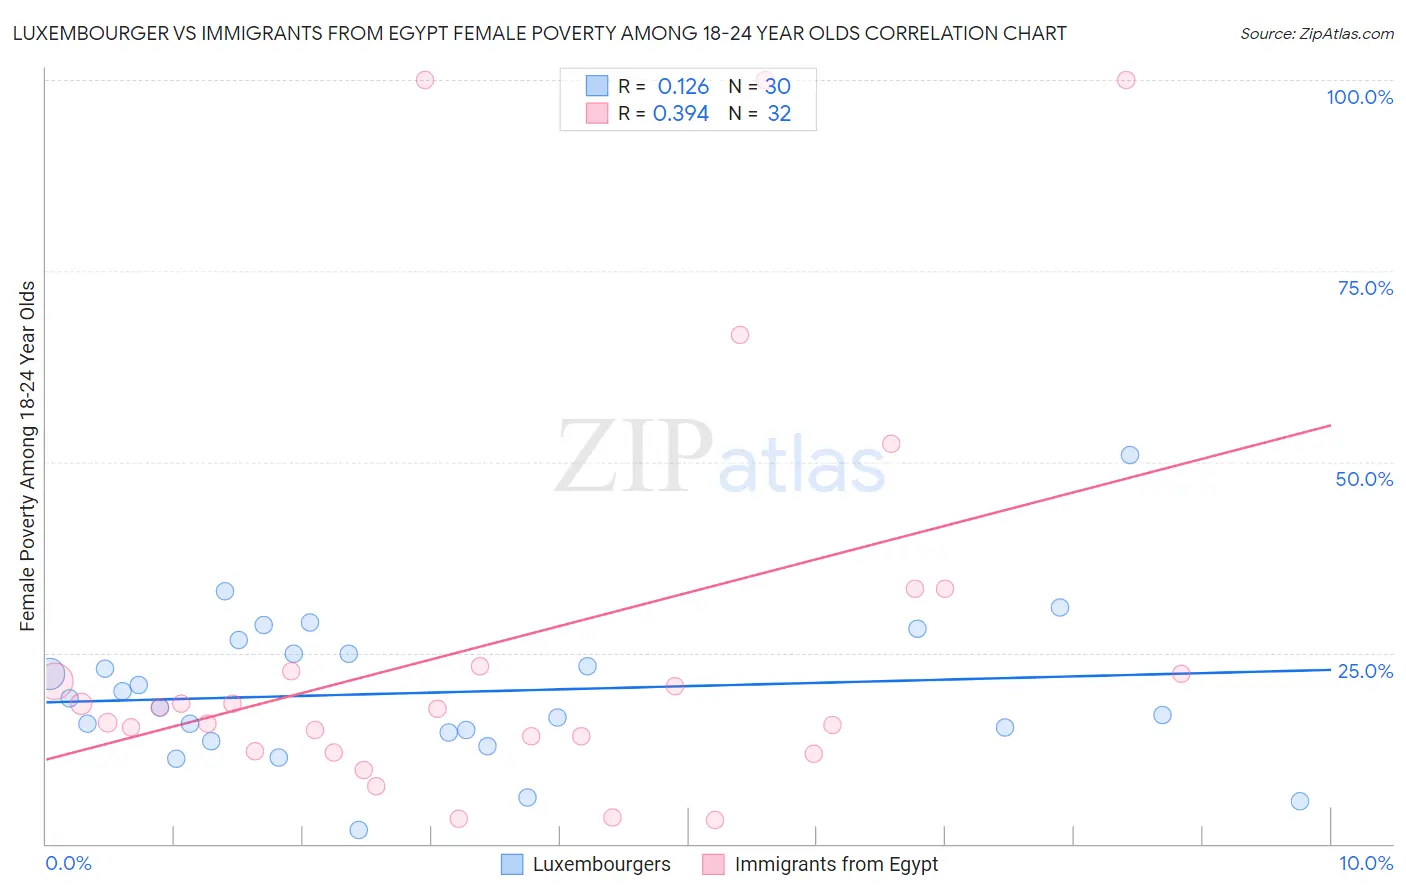
Luxembourger vs Immigrants from Egypt Female Poverty Among 18-24 Year Olds Correlation Chart
The statistical analysis conducted on geographies consisting of 142,199,227 people shows a poor positive correlation between the proportion of Luxembourgers and poverty level among females between the ages 18 and 24 in the United States with a correlation coefficient (R) of 0.126 and weighted average of 20.9%. Similarly, the statistical analysis conducted on geographies consisting of 241,711,219 people shows a mild positive correlation between the proportion of Immigrants from Egypt and poverty level among females between the ages 18 and 24 in the United States with a correlation coefficient (R) of 0.394 and weighted average of 18.4%, a difference of 13.6%.
Female Poverty Among 18-24 Year Olds Correlation Summary
| Measurement | Luxembourger | Immigrants from Egypt |
| Minimum | 1.9% | 3.1% |
| Maximum | 50.8% | 100.0% |
| Range | 49.0% | 96.9% |
| Mean | 19.8% | 26.7% |
| Median | 18.4% | 17.8% |
| Interquartile 25% (IQ1) | 14.5% | 13.1% |
| Interquartile 75% (IQ3) | 24.9% | 22.9% |
| Interquartile Range (IQR) | 10.5% | 9.9% |
| Standard Deviation (Sample) | 9.7% | 27.2% |
| Standard Deviation (Population) | 9.5% | 26.7% |
Similar Demographics by Female Poverty Among 18-24 Year Olds
Demographics Similar to Luxembourgers by Female Poverty Among 18-24 Year Olds
In terms of female poverty among 18-24 year olds, the demographic groups most similar to Luxembourgers are Immigrants from Eritrea (20.9%, a difference of 0.020%), Immigrants from Guatemala (20.9%, a difference of 0.030%), Israeli (20.9%, a difference of 0.030%), Immigrants from Singapore (20.9%, a difference of 0.040%), and Scottish (20.9%, a difference of 0.070%).
| Demographics | Rating | Rank | Female Poverty Among 18-24 Year Olds |
| Immigrants | Denmark | 5.8 /100 | #233 | Tragic 20.8% |
| Welsh | 5.4 /100 | #234 | Tragic 20.8% |
| Immigrants | Uganda | 5.1 /100 | #235 | Tragic 20.8% |
| Okinawans | 4.9 /100 | #236 | Tragic 20.8% |
| Scottish | 4.5 /100 | #237 | Tragic 20.9% |
| Immigrants | Singapore | 4.4 /100 | #238 | Tragic 20.9% |
| Immigrants | Guatemala | 4.3 /100 | #239 | Tragic 20.9% |
| Luxembourgers | 4.2 /100 | #240 | Tragic 20.9% |
| Immigrants | Eritrea | 4.2 /100 | #241 | Tragic 20.9% |
| Israelis | 4.1 /100 | #242 | Tragic 20.9% |
| Marshallese | 3.4 /100 | #243 | Tragic 20.9% |
| Immigrants | Thailand | 3.4 /100 | #244 | Tragic 20.9% |
| Aleuts | 3.3 /100 | #245 | Tragic 20.9% |
| Immigrants | Australia | 3.1 /100 | #246 | Tragic 20.9% |
| Immigrants | Africa | 3.0 /100 | #247 | Tragic 21.0% |
Demographics Similar to Immigrants from Egypt by Female Poverty Among 18-24 Year Olds
In terms of female poverty among 18-24 year olds, the demographic groups most similar to Immigrants from Egypt are Albanian (18.4%, a difference of 0.010%), Argentinean (18.4%, a difference of 0.020%), Immigrants from Italy (18.4%, a difference of 0.13%), Immigrants from Ukraine (18.4%, a difference of 0.19%), and Italian (18.3%, a difference of 0.22%).
| Demographics | Rating | Rank | Female Poverty Among 18-24 Year Olds |
| Asians | 100.0 /100 | #47 | Exceptional 18.2% |
| Sri Lankans | 100.0 /100 | #48 | Exceptional 18.2% |
| Bhutanese | 100.0 /100 | #49 | Exceptional 18.2% |
| Samoans | 100.0 /100 | #50 | Exceptional 18.2% |
| Immigrants | Eastern Europe | 99.9 /100 | #51 | Exceptional 18.2% |
| Immigrants | Ireland | 99.9 /100 | #52 | Exceptional 18.3% |
| Italians | 99.9 /100 | #53 | Exceptional 18.3% |
| Immigrants | Egypt | 99.9 /100 | #54 | Exceptional 18.4% |
| Albanians | 99.9 /100 | #55 | Exceptional 18.4% |
| Argentineans | 99.9 /100 | #56 | Exceptional 18.4% |
| Immigrants | Italy | 99.9 /100 | #57 | Exceptional 18.4% |
| Immigrants | Ukraine | 99.9 /100 | #58 | Exceptional 18.4% |
| Egyptians | 99.9 /100 | #59 | Exceptional 18.5% |
| Immigrants | Brazil | 99.8 /100 | #60 | Exceptional 18.5% |
| Immigrants | Albania | 99.8 /100 | #61 | Exceptional 18.5% |