Romanian vs Barbadian Female Poverty Among 18-24 Year Olds
COMPARE
Romanian
Barbadian
Female Poverty Among 18-24 Year Olds
Female Poverty Among 18-24 Year Olds Comparison
Romanians
Barbadians
19.0%
FEMALE POVERTY AMONG 18-24 YEAR OLDS
98.9/ 100
METRIC RATING
91st/ 347
METRIC RANK
20.7%
FEMALE POVERTY AMONG 18-24 YEAR OLDS
9.0/ 100
METRIC RATING
221st/ 347
METRIC RANK
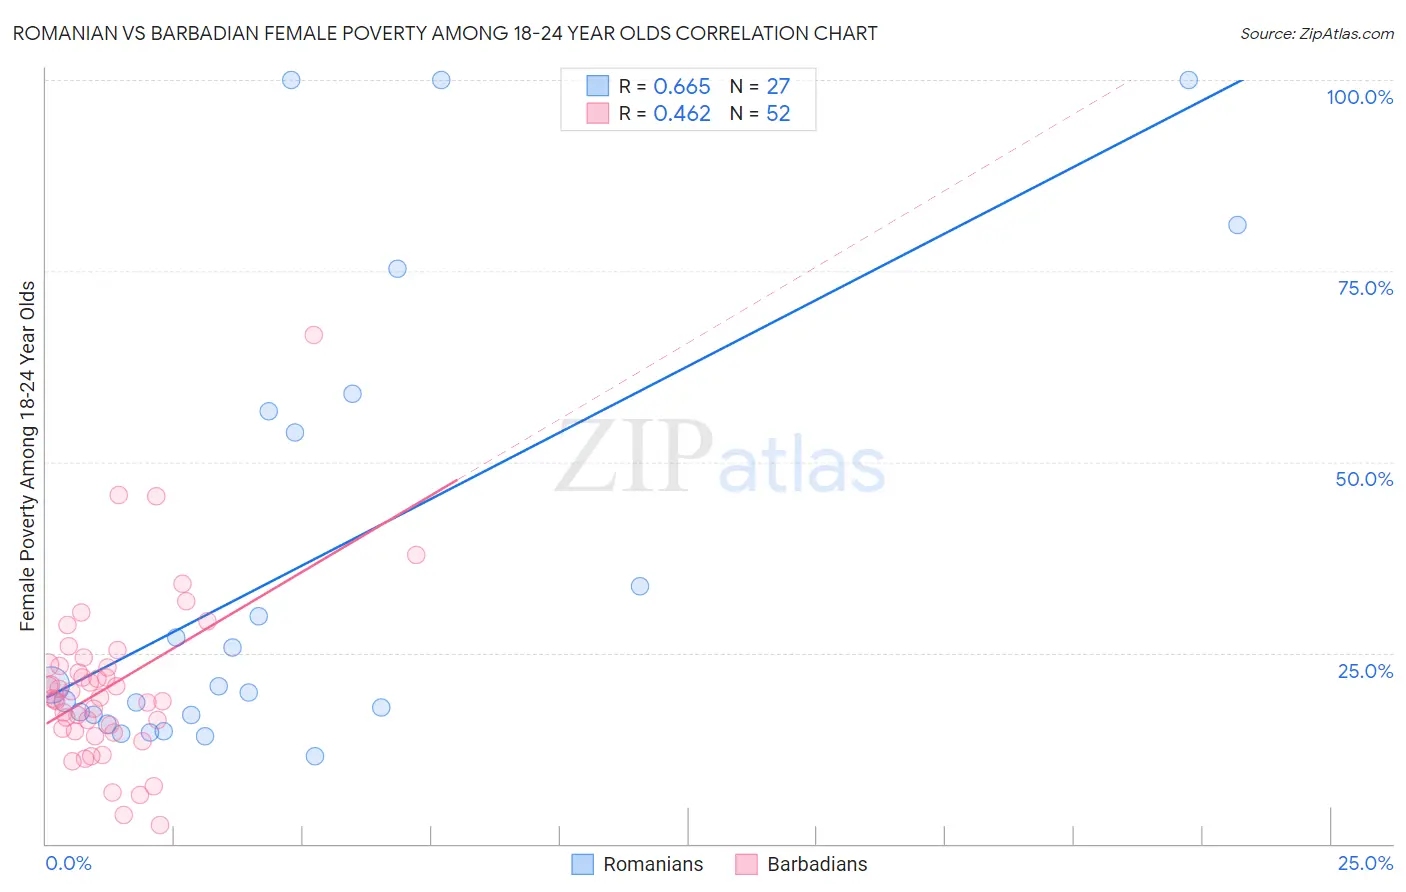
Romanian vs Barbadian Female Poverty Among 18-24 Year Olds Correlation Chart
The statistical analysis conducted on geographies consisting of 367,156,694 people shows a significant positive correlation between the proportion of Romanians and poverty level among females between the ages 18 and 24 in the United States with a correlation coefficient (R) of 0.665 and weighted average of 19.0%. Similarly, the statistical analysis conducted on geographies consisting of 140,037,273 people shows a moderate positive correlation between the proportion of Barbadians and poverty level among females between the ages 18 and 24 in the United States with a correlation coefficient (R) of 0.462 and weighted average of 20.7%, a difference of 8.9%.
Female Poverty Among 18-24 Year Olds Correlation Summary
| Measurement | Romanian | Barbadian |
| Minimum | 11.4% | 2.5% |
| Maximum | 100.0% | 66.7% |
| Range | 88.6% | 64.2% |
| Mean | 36.8% | 20.7% |
| Median | 20.7% | 19.1% |
| Interquartile 25% (IQ1) | 16.8% | 14.9% |
| Interquartile 75% (IQ3) | 56.7% | 23.4% |
| Interquartile Range (IQR) | 39.9% | 8.5% |
| Standard Deviation (Sample) | 29.7% | 11.0% |
| Standard Deviation (Population) | 29.2% | 10.9% |
Similar Demographics by Female Poverty Among 18-24 Year Olds
Demographics Similar to Romanians by Female Poverty Among 18-24 Year Olds
In terms of female poverty among 18-24 year olds, the demographic groups most similar to Romanians are Filipino (19.0%, a difference of 0.050%), Haitian (19.0%, a difference of 0.070%), Afghan (19.0%, a difference of 0.090%), Immigrants from Cabo Verde (19.0%, a difference of 0.12%), and Ukrainian (19.0%, a difference of 0.13%).
| Demographics | Rating | Rank | Female Poverty Among 18-24 Year Olds |
| Burmese | 99.2 /100 | #84 | Exceptional 18.9% |
| Immigrants | Armenia | 99.2 /100 | #85 | Exceptional 18.9% |
| Immigrants | Iraq | 99.2 /100 | #86 | Exceptional 18.9% |
| Immigrants | Jamaica | 99.2 /100 | #87 | Exceptional 18.9% |
| Croatians | 99.1 /100 | #88 | Exceptional 19.0% |
| Immigrants | Cabo Verde | 99.0 /100 | #89 | Exceptional 19.0% |
| Afghans | 99.0 /100 | #90 | Exceptional 19.0% |
| Romanians | 98.9 /100 | #91 | Exceptional 19.0% |
| Filipinos | 98.9 /100 | #92 | Exceptional 19.0% |
| Haitians | 98.9 /100 | #93 | Exceptional 19.0% |
| Ukrainians | 98.8 /100 | #94 | Exceptional 19.0% |
| Guamanians/Chamorros | 98.8 /100 | #95 | Exceptional 19.0% |
| Sierra Leoneans | 98.7 /100 | #96 | Exceptional 19.0% |
| Salvadorans | 98.4 /100 | #97 | Exceptional 19.1% |
| Immigrants | Jordan | 98.4 /100 | #98 | Exceptional 19.1% |
Demographics Similar to Barbadians by Female Poverty Among 18-24 Year Olds
In terms of female poverty among 18-24 year olds, the demographic groups most similar to Barbadians are British (20.7%, a difference of 0.070%), Immigrants from Micronesia (20.7%, a difference of 0.090%), Immigrants from Nepal (20.7%, a difference of 0.10%), Immigrants from Laos (20.6%, a difference of 0.11%), and Guatemalan (20.7%, a difference of 0.14%).
| Demographics | Rating | Rank | Female Poverty Among 18-24 Year Olds |
| Immigrants | South Africa | 10.7 /100 | #214 | Poor 20.6% |
| Spanish | 10.4 /100 | #215 | Poor 20.6% |
| Immigrants | Western Africa | 10.2 /100 | #216 | Poor 20.6% |
| Immigrants | Laos | 9.7 /100 | #217 | Tragic 20.6% |
| Immigrants | Nepal | 9.6 /100 | #218 | Tragic 20.7% |
| Immigrants | Micronesia | 9.6 /100 | #219 | Tragic 20.7% |
| British | 9.4 /100 | #220 | Tragic 20.7% |
| Barbadians | 9.0 /100 | #221 | Tragic 20.7% |
| Guatemalans | 8.1 /100 | #222 | Tragic 20.7% |
| French | 7.9 /100 | #223 | Tragic 20.7% |
| Immigrants | Liberia | 7.6 /100 | #224 | Tragic 20.7% |
| Norwegians | 7.3 /100 | #225 | Tragic 20.7% |
| Estonians | 7.2 /100 | #226 | Tragic 20.7% |
| Immigrants | Sweden | 6.8 /100 | #227 | Tragic 20.7% |
| Ghanaians | 6.5 /100 | #228 | Tragic 20.8% |