Romanian vs Immigrants from Czechoslovakia Seniors Poverty Over the Age of 75
COMPARE
Romanian
Immigrants from Czechoslovakia
Seniors Poverty Over the Age of 75
Seniors Poverty Over the Age of 75 Comparison
Romanians
Immigrants from Czechoslovakia
11.6%
SENIORS POVERTY OVER THE AGE OF 75
92.3/ 100
METRIC RATING
97th/ 347
METRIC RANK
11.7%
SENIORS POVERTY OVER THE AGE OF 75
87.0/ 100
METRIC RATING
113th/ 347
METRIC RANK
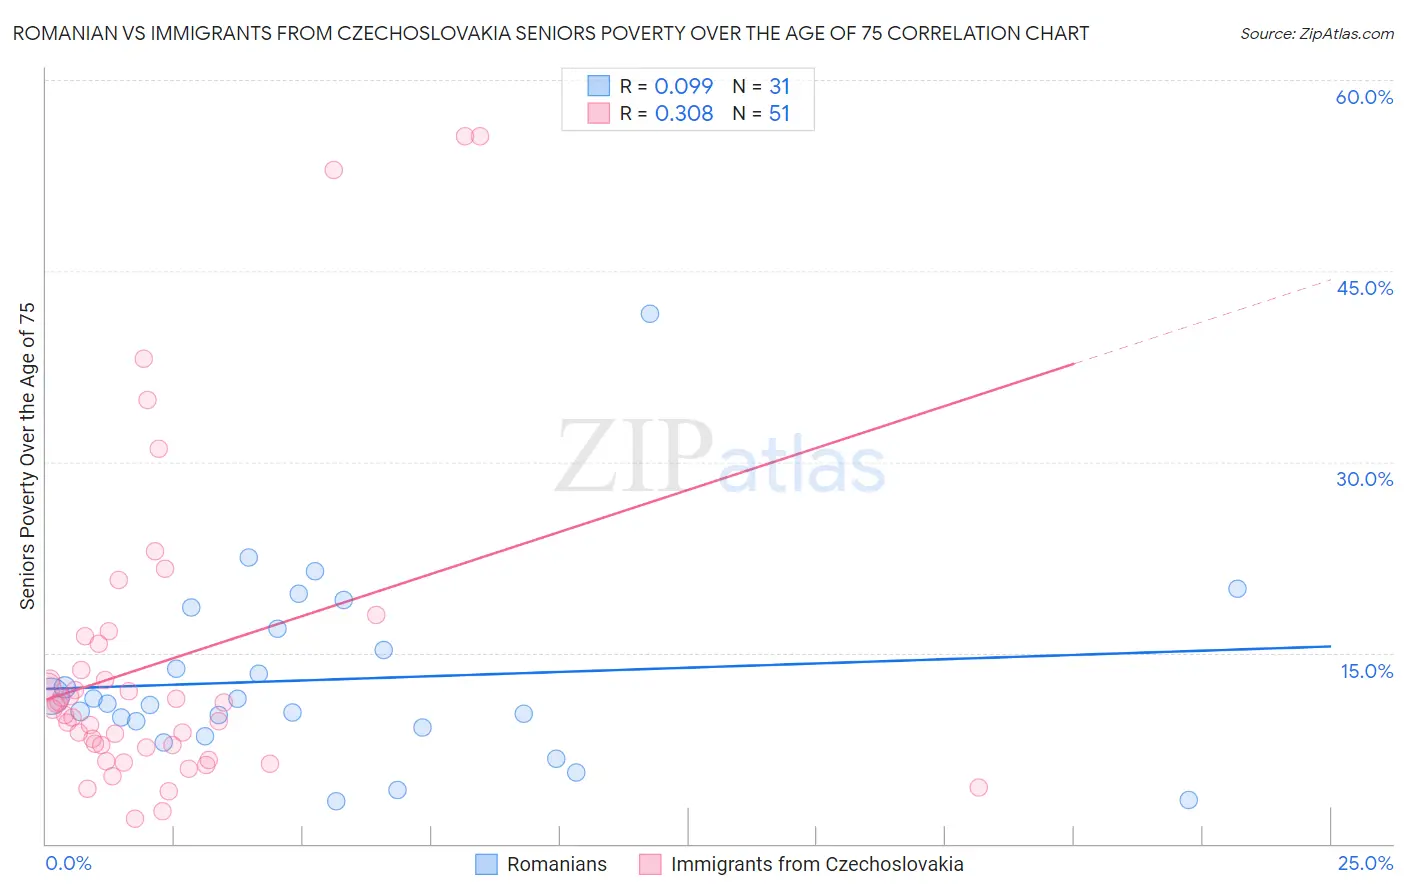
Romanian vs Immigrants from Czechoslovakia Seniors Poverty Over the Age of 75 Correlation Chart
The statistical analysis conducted on geographies consisting of 373,710,201 people shows a slight positive correlation between the proportion of Romanians and poverty level among seniors over the age of 75 in the United States with a correlation coefficient (R) of 0.099 and weighted average of 11.6%. Similarly, the statistical analysis conducted on geographies consisting of 194,223,465 people shows a mild positive correlation between the proportion of Immigrants from Czechoslovakia and poverty level among seniors over the age of 75 in the United States with a correlation coefficient (R) of 0.308 and weighted average of 11.7%, a difference of 1.3%.
Seniors Poverty Over the Age of 75 Correlation Summary
| Measurement | Romanian | Immigrants from Czechoslovakia |
| Minimum | 3.3% | 1.9% |
| Maximum | 41.7% | 55.6% |
| Range | 38.3% | 53.6% |
| Mean | 12.9% | 14.3% |
| Median | 11.0% | 10.6% |
| Interquartile 25% (IQ1) | 9.1% | 7.6% |
| Interquartile 75% (IQ3) | 16.9% | 15.7% |
| Interquartile Range (IQR) | 7.8% | 8.2% |
| Standard Deviation (Sample) | 7.4% | 12.6% |
| Standard Deviation (Population) | 7.3% | 12.5% |
Demographics Similar to Romanians and Immigrants from Czechoslovakia by Seniors Poverty Over the Age of 75
In terms of seniors poverty over the age of 75, the demographic groups most similar to Romanians are Immigrants from Bosnia and Herzegovina (11.6%, a difference of 0.080%), Immigrants from Sweden (11.6%, a difference of 0.080%), Immigrants from Japan (11.6%, a difference of 0.11%), Immigrants from Ethiopia (11.6%, a difference of 0.18%), and Syrian (11.6%, a difference of 0.34%). Similarly, the demographic groups most similar to Immigrants from Czechoslovakia are Ukrainian (11.7%, a difference of 0.010%), New Zealander (11.7%, a difference of 0.11%), Immigrants from Bolivia (11.7%, a difference of 0.28%), Immigrants from Jordan (11.7%, a difference of 0.34%), and Burmese (11.7%, a difference of 0.34%).
| Demographics | Rating | Rank | Seniors Poverty Over the Age of 75 |
| Immigrants | Bosnia and Herzegovina | 92.6 /100 | #95 | Exceptional 11.6% |
| Immigrants | Sweden | 92.6 /100 | #96 | Exceptional 11.6% |
| Romanians | 92.3 /100 | #97 | Exceptional 11.6% |
| Immigrants | Japan | 91.9 /100 | #98 | Exceptional 11.6% |
| Immigrants | Ethiopia | 91.7 /100 | #99 | Exceptional 11.6% |
| Syrians | 91.1 /100 | #100 | Exceptional 11.6% |
| Jordanians | 90.8 /100 | #101 | Exceptional 11.6% |
| Guamanians/Chamorros | 90.6 /100 | #102 | Exceptional 11.6% |
| Immigrants | Kuwait | 90.5 /100 | #103 | Exceptional 11.6% |
| Immigrants | Singapore | 90.3 /100 | #104 | Exceptional 11.6% |
| Chickasaw | 90.2 /100 | #105 | Exceptional 11.6% |
| Russians | 89.9 /100 | #106 | Excellent 11.6% |
| Immigrants | Oceania | 89.4 /100 | #107 | Excellent 11.7% |
| Turks | 89.4 /100 | #108 | Excellent 11.7% |
| South Africans | 89.3 /100 | #109 | Excellent 11.7% |
| Immigrants | Jordan | 88.7 /100 | #110 | Excellent 11.7% |
| Burmese | 88.7 /100 | #111 | Excellent 11.7% |
| Immigrants | Bolivia | 88.4 /100 | #112 | Excellent 11.7% |
| Immigrants | Czechoslovakia | 87.0 /100 | #113 | Excellent 11.7% |
| Ukrainians | 86.9 /100 | #114 | Excellent 11.7% |
| New Zealanders | 86.3 /100 | #115 | Excellent 11.7% |