Immigrants from Chile vs Immigrants from Czechoslovakia Seniors Poverty Over the Age of 75
COMPARE
Immigrants from Chile
Immigrants from Czechoslovakia
Seniors Poverty Over the Age of 75
Seniors Poverty Over the Age of 75 Comparison
Immigrants from Chile
Immigrants from Czechoslovakia
13.3%
SENIORS POVERTY OVER THE AGE OF 75
1.3/ 100
METRIC RATING
232nd/ 347
METRIC RANK
11.7%
SENIORS POVERTY OVER THE AGE OF 75
87.0/ 100
METRIC RATING
113th/ 347
METRIC RANK
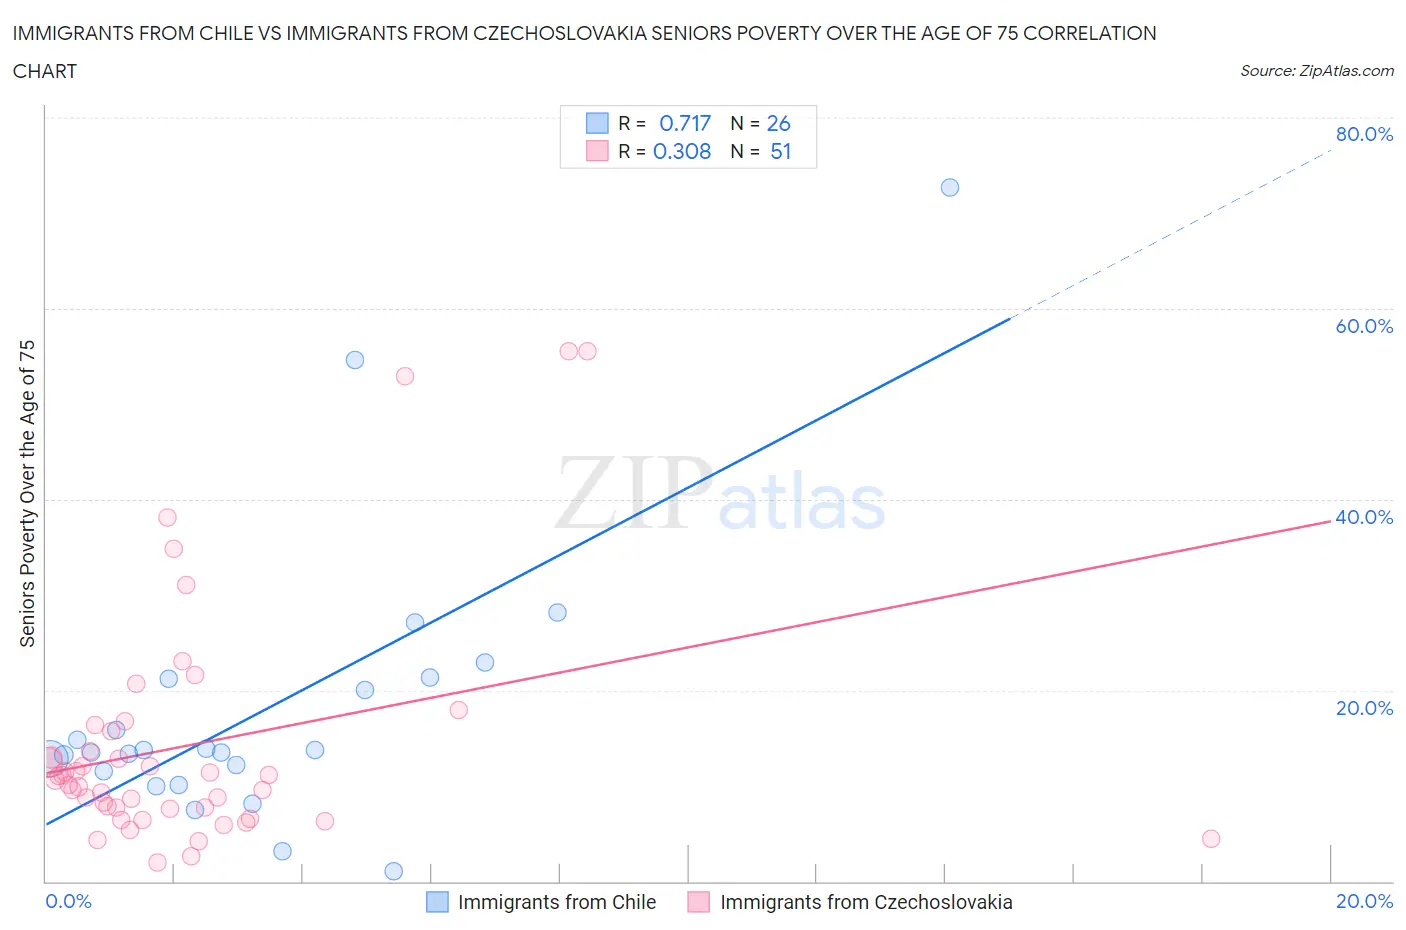
Immigrants from Chile vs Immigrants from Czechoslovakia Seniors Poverty Over the Age of 75 Correlation Chart
The statistical analysis conducted on geographies consisting of 217,254,783 people shows a strong positive correlation between the proportion of Immigrants from Chile and poverty level among seniors over the age of 75 in the United States with a correlation coefficient (R) of 0.717 and weighted average of 13.3%. Similarly, the statistical analysis conducted on geographies consisting of 194,223,465 people shows a mild positive correlation between the proportion of Immigrants from Czechoslovakia and poverty level among seniors over the age of 75 in the United States with a correlation coefficient (R) of 0.308 and weighted average of 11.7%, a difference of 13.1%.
Seniors Poverty Over the Age of 75 Correlation Summary
| Measurement | Immigrants from Chile | Immigrants from Czechoslovakia |
| Minimum | 0.99% | 1.9% |
| Maximum | 72.7% | 55.6% |
| Range | 71.7% | 53.6% |
| Mean | 18.1% | 14.3% |
| Median | 13.6% | 10.6% |
| Interquartile 25% (IQ1) | 11.6% | 7.6% |
| Interquartile 75% (IQ3) | 21.3% | 15.7% |
| Interquartile Range (IQR) | 9.7% | 8.2% |
| Standard Deviation (Sample) | 15.1% | 12.6% |
| Standard Deviation (Population) | 14.8% | 12.5% |
Similar Demographics by Seniors Poverty Over the Age of 75
Demographics Similar to Immigrants from Chile by Seniors Poverty Over the Age of 75
In terms of seniors poverty over the age of 75, the demographic groups most similar to Immigrants from Chile are Immigrants from Costa Rica (13.3%, a difference of 0.030%), Subsaharan African (13.2%, a difference of 0.20%), Immigrants from China (13.2%, a difference of 0.22%), Somali (13.2%, a difference of 0.30%), and Immigrants from Israel (13.3%, a difference of 0.37%).
| Demographics | Rating | Rank | Seniors Poverty Over the Age of 75 |
| Immigrants | Morocco | 2.8 /100 | #225 | Tragic 13.1% |
| Shoshone | 2.6 /100 | #226 | Tragic 13.1% |
| Cree | 2.3 /100 | #227 | Tragic 13.1% |
| Israelis | 2.0 /100 | #228 | Tragic 13.2% |
| Somalis | 1.6 /100 | #229 | Tragic 13.2% |
| Immigrants | China | 1.5 /100 | #230 | Tragic 13.2% |
| Sub-Saharan Africans | 1.5 /100 | #231 | Tragic 13.2% |
| Immigrants | Chile | 1.3 /100 | #232 | Tragic 13.3% |
| Immigrants | Costa Rica | 1.3 /100 | #233 | Tragic 13.3% |
| Immigrants | Israel | 1.1 /100 | #234 | Tragic 13.3% |
| Japanese | 0.9 /100 | #235 | Tragic 13.3% |
| Moroccans | 0.9 /100 | #236 | Tragic 13.3% |
| Alaskan Athabascans | 0.8 /100 | #237 | Tragic 13.4% |
| Peruvians | 0.8 /100 | #238 | Tragic 13.4% |
| Panamanians | 0.8 /100 | #239 | Tragic 13.4% |
Demographics Similar to Immigrants from Czechoslovakia by Seniors Poverty Over the Age of 75
In terms of seniors poverty over the age of 75, the demographic groups most similar to Immigrants from Czechoslovakia are Ukrainian (11.7%, a difference of 0.010%), New Zealander (11.7%, a difference of 0.11%), Iraqi (11.7%, a difference of 0.11%), Icelander (11.7%, a difference of 0.22%), and Immigrants from Zimbabwe (11.7%, a difference of 0.26%).
| Demographics | Rating | Rank | Seniors Poverty Over the Age of 75 |
| Russians | 89.9 /100 | #106 | Excellent 11.6% |
| Immigrants | Oceania | 89.4 /100 | #107 | Excellent 11.7% |
| Turks | 89.4 /100 | #108 | Excellent 11.7% |
| South Africans | 89.3 /100 | #109 | Excellent 11.7% |
| Immigrants | Jordan | 88.7 /100 | #110 | Excellent 11.7% |
| Burmese | 88.7 /100 | #111 | Excellent 11.7% |
| Immigrants | Bolivia | 88.4 /100 | #112 | Excellent 11.7% |
| Immigrants | Czechoslovakia | 87.0 /100 | #113 | Excellent 11.7% |
| Ukrainians | 86.9 /100 | #114 | Excellent 11.7% |
| New Zealanders | 86.3 /100 | #115 | Excellent 11.7% |
| Iraqis | 86.3 /100 | #116 | Excellent 11.7% |
| Icelanders | 85.7 /100 | #117 | Excellent 11.7% |
| Immigrants | Zimbabwe | 85.5 /100 | #118 | Excellent 11.7% |
| Immigrants | Uganda | 84.8 /100 | #119 | Excellent 11.8% |
| Immigrants | Nepal | 84.5 /100 | #120 | Excellent 11.8% |