Romanian vs Immigrants from Czechoslovakia In Labor Force | Age > 16
COMPARE
Romanian
Immigrants from Czechoslovakia
In Labor Force | Age > 16
In Labor Force | Age > 16 Comparison
Romanians
Immigrants from Czechoslovakia
65.0%
IN LABOR FORCE | AGE > 16
31.1/ 100
METRIC RATING
195th/ 347
METRIC RANK
64.8%
IN LABOR FORCE | AGE > 16
12.3/ 100
METRIC RATING
215th/ 347
METRIC RANK
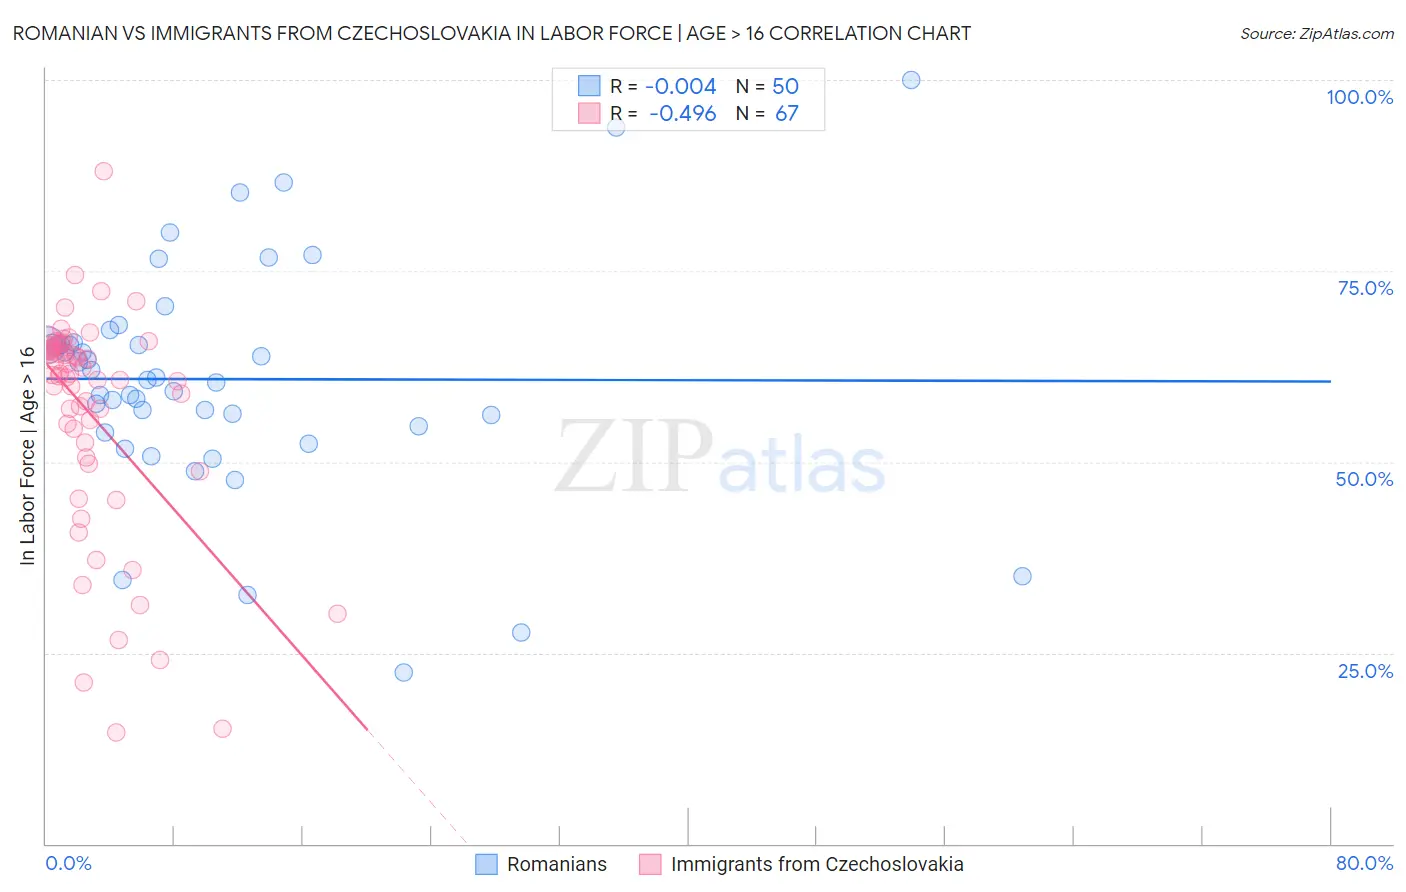
Romanian vs Immigrants from Czechoslovakia In Labor Force | Age > 16 Correlation Chart
The statistical analysis conducted on geographies consisting of 377,921,864 people shows no correlation between the proportion of Romanians and labor force participation rate among population ages 16 and over in the United States with a correlation coefficient (R) of -0.004 and weighted average of 65.0%. Similarly, the statistical analysis conducted on geographies consisting of 195,457,762 people shows a moderate negative correlation between the proportion of Immigrants from Czechoslovakia and labor force participation rate among population ages 16 and over in the United States with a correlation coefficient (R) of -0.496 and weighted average of 64.8%, a difference of 0.33%.
In Labor Force | Age > 16 Correlation Summary
| Measurement | Romanian | Immigrants from Czechoslovakia |
| Minimum | 22.5% | 14.5% |
| Maximum | 100.0% | 88.1% |
| Range | 77.5% | 73.6% |
| Mean | 60.8% | 56.2% |
| Median | 60.9% | 61.4% |
| Interquartile 25% (IQ1) | 54.7% | 50.6% |
| Interquartile 75% (IQ3) | 65.3% | 64.9% |
| Interquartile Range (IQR) | 10.6% | 14.3% |
| Standard Deviation (Sample) | 15.0% | 14.7% |
| Standard Deviation (Population) | 14.8% | 14.6% |
Demographics Similar to Romanians and Immigrants from Czechoslovakia by In Labor Force | Age > 16
In terms of in labor force | age > 16, the demographic groups most similar to Romanians are Haitian (65.0%, a difference of 0.010%), Immigrants from Italy (65.0%, a difference of 0.030%), Greek (64.9%, a difference of 0.070%), Mexican American Indian (64.9%, a difference of 0.11%), and Armenian (64.9%, a difference of 0.16%). Similarly, the demographic groups most similar to Immigrants from Czechoslovakia are Estonian (64.8%, a difference of 0.020%), Alaskan Athabascan (64.8%, a difference of 0.040%), Maltese (64.8%, a difference of 0.040%), Fijian (64.8%, a difference of 0.050%), and Immigrants from Denmark (64.8%, a difference of 0.060%).
| Demographics | Rating | Rank | In Labor Force | Age > 16 |
| Romanians | 31.1 /100 | #195 | Fair 65.0% |
| Haitians | 30.6 /100 | #196 | Fair 65.0% |
| Immigrants | Italy | 28.7 /100 | #197 | Fair 65.0% |
| Greeks | 26.1 /100 | #198 | Fair 64.9% |
| Mexican American Indians | 23.1 /100 | #199 | Fair 64.9% |
| Armenians | 20.2 /100 | #200 | Fair 64.9% |
| Ukrainians | 19.6 /100 | #201 | Poor 64.9% |
| Immigrants | Belgium | 19.4 /100 | #202 | Poor 64.9% |
| Russians | 18.8 /100 | #203 | Poor 64.9% |
| Slovenes | 18.7 /100 | #204 | Poor 64.9% |
| Jamaicans | 18.7 /100 | #205 | Poor 64.9% |
| Lithuanians | 17.4 /100 | #206 | Poor 64.8% |
| Immigrants | Latin America | 16.4 /100 | #207 | Poor 64.8% |
| Belizeans | 16.2 /100 | #208 | Poor 64.8% |
| Immigrants | Trinidad and Tobago | 15.6 /100 | #209 | Poor 64.8% |
| Immigrants | Denmark | 14.7 /100 | #210 | Poor 64.8% |
| Fijians | 14.1 /100 | #211 | Poor 64.8% |
| Alaskan Athabascans | 13.9 /100 | #212 | Poor 64.8% |
| Maltese | 13.8 /100 | #213 | Poor 64.8% |
| Estonians | 13.1 /100 | #214 | Poor 64.8% |
| Immigrants | Czechoslovakia | 12.3 /100 | #215 | Poor 64.8% |