Romanian vs Immigrants from Cabo Verde Seniors Poverty Over the Age of 75
COMPARE
Romanian
Immigrants from Cabo Verde
Seniors Poverty Over the Age of 75
Seniors Poverty Over the Age of 75 Comparison
Romanians
Immigrants from Cabo Verde
11.6%
SENIORS POVERTY OVER THE AGE OF 75
92.3/ 100
METRIC RATING
97th/ 347
METRIC RANK
18.5%
SENIORS POVERTY OVER THE AGE OF 75
0.0/ 100
METRIC RATING
338th/ 347
METRIC RANK
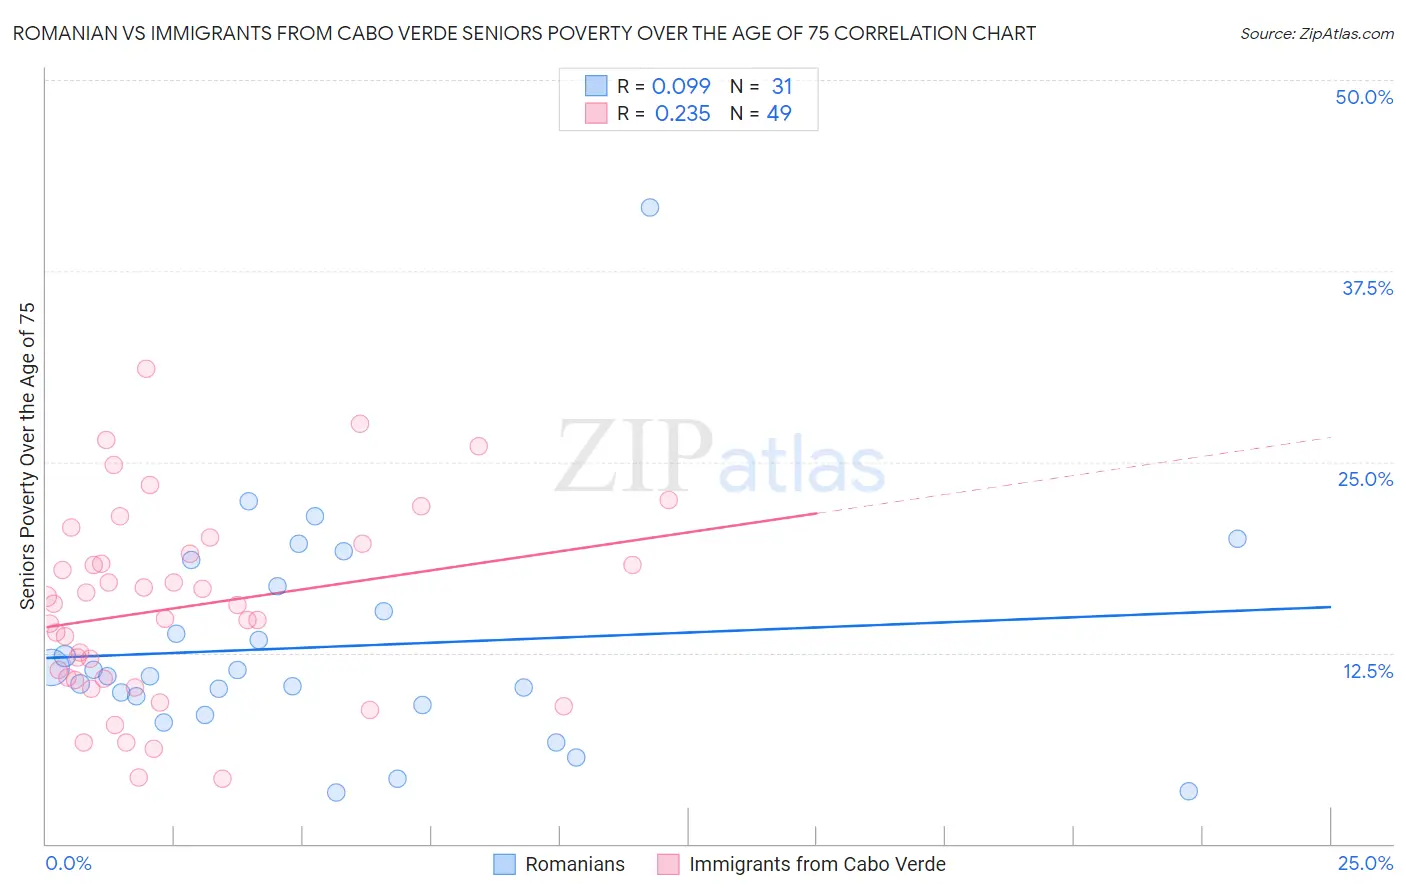
Romanian vs Immigrants from Cabo Verde Seniors Poverty Over the Age of 75 Correlation Chart
The statistical analysis conducted on geographies consisting of 373,710,201 people shows a slight positive correlation between the proportion of Romanians and poverty level among seniors over the age of 75 in the United States with a correlation coefficient (R) of 0.099 and weighted average of 11.6%. Similarly, the statistical analysis conducted on geographies consisting of 37,992,764 people shows a weak positive correlation between the proportion of Immigrants from Cabo Verde and poverty level among seniors over the age of 75 in the United States with a correlation coefficient (R) of 0.235 and weighted average of 18.5%, a difference of 59.8%.
Seniors Poverty Over the Age of 75 Correlation Summary
| Measurement | Romanian | Immigrants from Cabo Verde |
| Minimum | 3.3% | 4.3% |
| Maximum | 41.7% | 31.1% |
| Range | 38.3% | 26.8% |
| Mean | 12.9% | 15.5% |
| Median | 11.0% | 15.6% |
| Interquartile 25% (IQ1) | 9.1% | 10.8% |
| Interquartile 75% (IQ3) | 16.9% | 19.3% |
| Interquartile Range (IQR) | 7.8% | 8.6% |
| Standard Deviation (Sample) | 7.4% | 6.2% |
| Standard Deviation (Population) | 7.3% | 6.2% |
Similar Demographics by Seniors Poverty Over the Age of 75
Demographics Similar to Romanians by Seniors Poverty Over the Age of 75
In terms of seniors poverty over the age of 75, the demographic groups most similar to Romanians are Immigrants from Bosnia and Herzegovina (11.6%, a difference of 0.080%), Immigrants from Sweden (11.6%, a difference of 0.080%), Immigrants from Japan (11.6%, a difference of 0.11%), Creek (11.6%, a difference of 0.13%), and Immigrants from Poland (11.6%, a difference of 0.17%).
| Demographics | Rating | Rank | Seniors Poverty Over the Age of 75 |
| Aleuts | 94.1 /100 | #90 | Exceptional 11.5% |
| Immigrants | Germany | 94.1 /100 | #91 | Exceptional 11.5% |
| Kenyans | 93.9 /100 | #92 | Exceptional 11.5% |
| Immigrants | Poland | 92.9 /100 | #93 | Exceptional 11.6% |
| Creek | 92.7 /100 | #94 | Exceptional 11.6% |
| Immigrants | Bosnia and Herzegovina | 92.6 /100 | #95 | Exceptional 11.6% |
| Immigrants | Sweden | 92.6 /100 | #96 | Exceptional 11.6% |
| Romanians | 92.3 /100 | #97 | Exceptional 11.6% |
| Immigrants | Japan | 91.9 /100 | #98 | Exceptional 11.6% |
| Immigrants | Ethiopia | 91.7 /100 | #99 | Exceptional 11.6% |
| Syrians | 91.1 /100 | #100 | Exceptional 11.6% |
| Jordanians | 90.8 /100 | #101 | Exceptional 11.6% |
| Guamanians/Chamorros | 90.6 /100 | #102 | Exceptional 11.6% |
| Immigrants | Kuwait | 90.5 /100 | #103 | Exceptional 11.6% |
| Immigrants | Singapore | 90.3 /100 | #104 | Exceptional 11.6% |
Demographics Similar to Immigrants from Cabo Verde by Seniors Poverty Over the Age of 75
In terms of seniors poverty over the age of 75, the demographic groups most similar to Immigrants from Cabo Verde are Yakama (18.3%, a difference of 0.97%), Immigrants from Caribbean (18.2%, a difference of 1.4%), Hopi (18.9%, a difference of 2.0%), Cuban (18.0%, a difference of 3.0%), and Tohono O'odham (19.1%, a difference of 3.5%).
| Demographics | Rating | Rank | Seniors Poverty Over the Age of 75 |
| Immigrants | Armenia | 0.0 /100 | #331 | Tragic 17.5% |
| Immigrants | St. Vincent and the Grenadines | 0.0 /100 | #332 | Tragic 17.5% |
| Immigrants | Nicaragua | 0.0 /100 | #333 | Tragic 17.6% |
| Immigrants | Grenada | 0.0 /100 | #334 | Tragic 17.8% |
| Cubans | 0.0 /100 | #335 | Tragic 18.0% |
| Immigrants | Caribbean | 0.0 /100 | #336 | Tragic 18.2% |
| Yakama | 0.0 /100 | #337 | Tragic 18.3% |
| Immigrants | Cabo Verde | 0.0 /100 | #338 | Tragic 18.5% |
| Hopi | 0.0 /100 | #339 | Tragic 18.9% |
| Tohono O'odham | 0.0 /100 | #340 | Tragic 19.1% |
| Navajo | 0.0 /100 | #341 | Tragic 19.4% |
| Dominicans | 0.0 /100 | #342 | Tragic 19.6% |
| Lumbee | 0.0 /100 | #343 | Tragic 19.7% |
| Immigrants | Cuba | 0.0 /100 | #344 | Tragic 19.9% |
| Immigrants | Dominican Republic | 0.0 /100 | #345 | Tragic 20.1% |