Puget Sound Salish vs French Canadian Child Poverty Among Girls Under 16
COMPARE
Puget Sound Salish
French Canadian
Child Poverty Among Girls Under 16
Child Poverty Among Girls Under 16 Comparison
Puget Sound Salish
French Canadians
15.4%
CHILD POVERTY AMONG GIRLS UNDER 16
90.1/ 100
METRIC RATING
130th/ 347
METRIC RANK
16.1%
CHILD POVERTY AMONG GIRLS UNDER 16
68.7/ 100
METRIC RATING
162nd/ 347
METRIC RANK
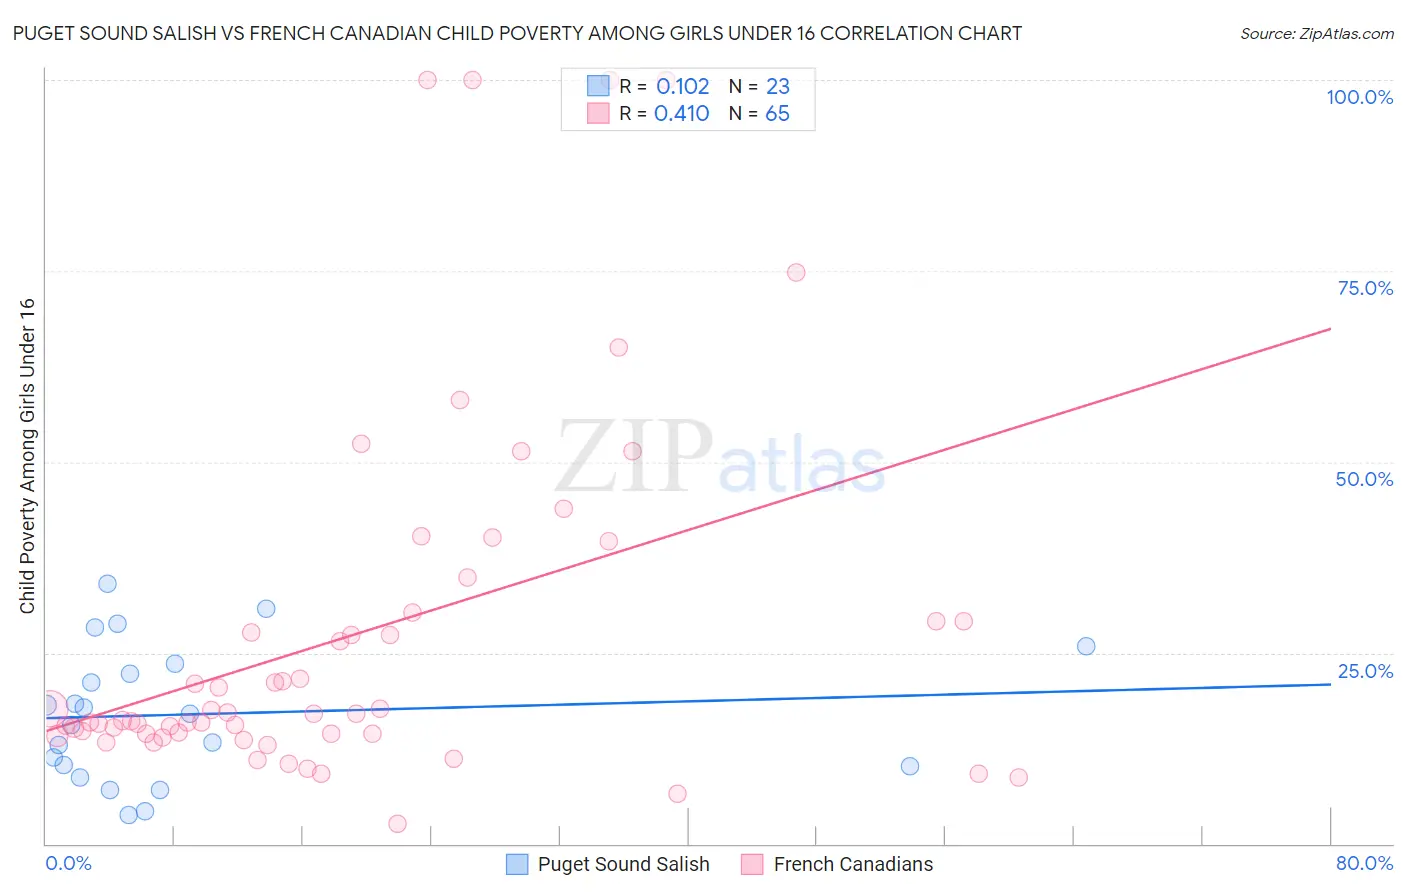
Puget Sound Salish vs French Canadian Child Poverty Among Girls Under 16 Correlation Chart
The statistical analysis conducted on geographies consisting of 45,926,658 people shows a poor positive correlation between the proportion of Puget Sound Salish and poverty level among girls under the age of 16 in the United States with a correlation coefficient (R) of 0.102 and weighted average of 15.4%. Similarly, the statistical analysis conducted on geographies consisting of 487,191,826 people shows a moderate positive correlation between the proportion of French Canadians and poverty level among girls under the age of 16 in the United States with a correlation coefficient (R) of 0.410 and weighted average of 16.1%, a difference of 4.3%.
Child Poverty Among Girls Under 16 Correlation Summary
| Measurement | Puget Sound Salish | French Canadian |
| Minimum | 3.7% | 2.6% |
| Maximum | 34.1% | 100.0% |
| Range | 30.4% | 97.4% |
| Mean | 17.0% | 27.4% |
| Median | 17.0% | 17.1% |
| Interquartile 25% (IQ1) | 10.2% | 14.4% |
| Interquartile 75% (IQ3) | 23.5% | 29.7% |
| Interquartile Range (IQR) | 13.3% | 15.3% |
| Standard Deviation (Sample) | 8.7% | 23.7% |
| Standard Deviation (Population) | 8.5% | 23.5% |
Similar Demographics by Child Poverty Among Girls Under 16
Demographics Similar to Puget Sound Salish by Child Poverty Among Girls Under 16
In terms of child poverty among girls under 16, the demographic groups most similar to Puget Sound Salish are Immigrants from Western Europe (15.4%, a difference of 0.020%), Mongolian (15.4%, a difference of 0.13%), Brazilian (15.4%, a difference of 0.15%), Immigrants from South Eastern Asia (15.4%, a difference of 0.16%), and Albanian (15.4%, a difference of 0.17%).
| Demographics | Rating | Rank | Child Poverty Among Girls Under 16 |
| Irish | 91.5 /100 | #123 | Exceptional 15.3% |
| Carpatho Rusyns | 91.4 /100 | #124 | Exceptional 15.3% |
| Peruvians | 91.2 /100 | #125 | Exceptional 15.4% |
| Scottish | 91.0 /100 | #126 | Exceptional 15.4% |
| Immigrants | Norway | 90.8 /100 | #127 | Exceptional 15.4% |
| Albanians | 90.5 /100 | #128 | Exceptional 15.4% |
| Immigrants | South Eastern Asia | 90.5 /100 | #129 | Exceptional 15.4% |
| Puget Sound Salish | 90.1 /100 | #130 | Exceptional 15.4% |
| Immigrants | Western Europe | 90.0 /100 | #131 | Exceptional 15.4% |
| Mongolians | 89.7 /100 | #132 | Excellent 15.4% |
| Brazilians | 89.6 /100 | #133 | Excellent 15.4% |
| Immigrants | Spain | 89.1 /100 | #134 | Excellent 15.5% |
| Czechoslovakians | 89.0 /100 | #135 | Excellent 15.5% |
| Native Hawaiians | 89.0 /100 | #136 | Excellent 15.5% |
| South Africans | 88.7 /100 | #137 | Excellent 15.5% |
Demographics Similar to French Canadians by Child Poverty Among Girls Under 16
In terms of child poverty among girls under 16, the demographic groups most similar to French Canadians are Immigrants from Oceania (16.1%, a difference of 0.050%), Immigrants from Colombia (16.1%, a difference of 0.11%), Immigrants from Germany (16.1%, a difference of 0.19%), South American (16.1%, a difference of 0.21%), and Immigrants from Northern Africa (16.0%, a difference of 0.47%).
| Demographics | Rating | Rank | Child Poverty Among Girls Under 16 |
| Syrians | 76.7 /100 | #155 | Good 15.9% |
| Immigrants | Fiji | 76.1 /100 | #156 | Good 15.9% |
| Colombians | 76.1 /100 | #157 | Good 15.9% |
| Guamanians/Chamorros | 75.3 /100 | #158 | Good 15.9% |
| Slovaks | 75.2 /100 | #159 | Good 15.9% |
| French | 72.8 /100 | #160 | Good 16.0% |
| Immigrants | Northern Africa | 72.0 /100 | #161 | Good 16.0% |
| French Canadians | 68.7 /100 | #162 | Good 16.1% |
| Immigrants | Oceania | 68.4 /100 | #163 | Good 16.1% |
| Immigrants | Colombia | 67.8 /100 | #164 | Good 16.1% |
| Immigrants | Germany | 67.3 /100 | #165 | Good 16.1% |
| South Americans | 67.2 /100 | #166 | Good 16.1% |
| Uruguayans | 64.7 /100 | #167 | Good 16.2% |
| Yugoslavians | 64.4 /100 | #168 | Good 16.2% |
| Costa Ricans | 64.2 /100 | #169 | Good 16.2% |