Immigrants from Sudan vs French Canadian Child Poverty Among Girls Under 16
COMPARE
Immigrants from Sudan
French Canadian
Child Poverty Among Girls Under 16
Child Poverty Among Girls Under 16 Comparison
Immigrants from Sudan
French Canadians
18.6%
CHILD POVERTY AMONG GIRLS UNDER 16
1.1/ 100
METRIC RATING
232nd/ 347
METRIC RANK
16.1%
CHILD POVERTY AMONG GIRLS UNDER 16
68.7/ 100
METRIC RATING
162nd/ 347
METRIC RANK
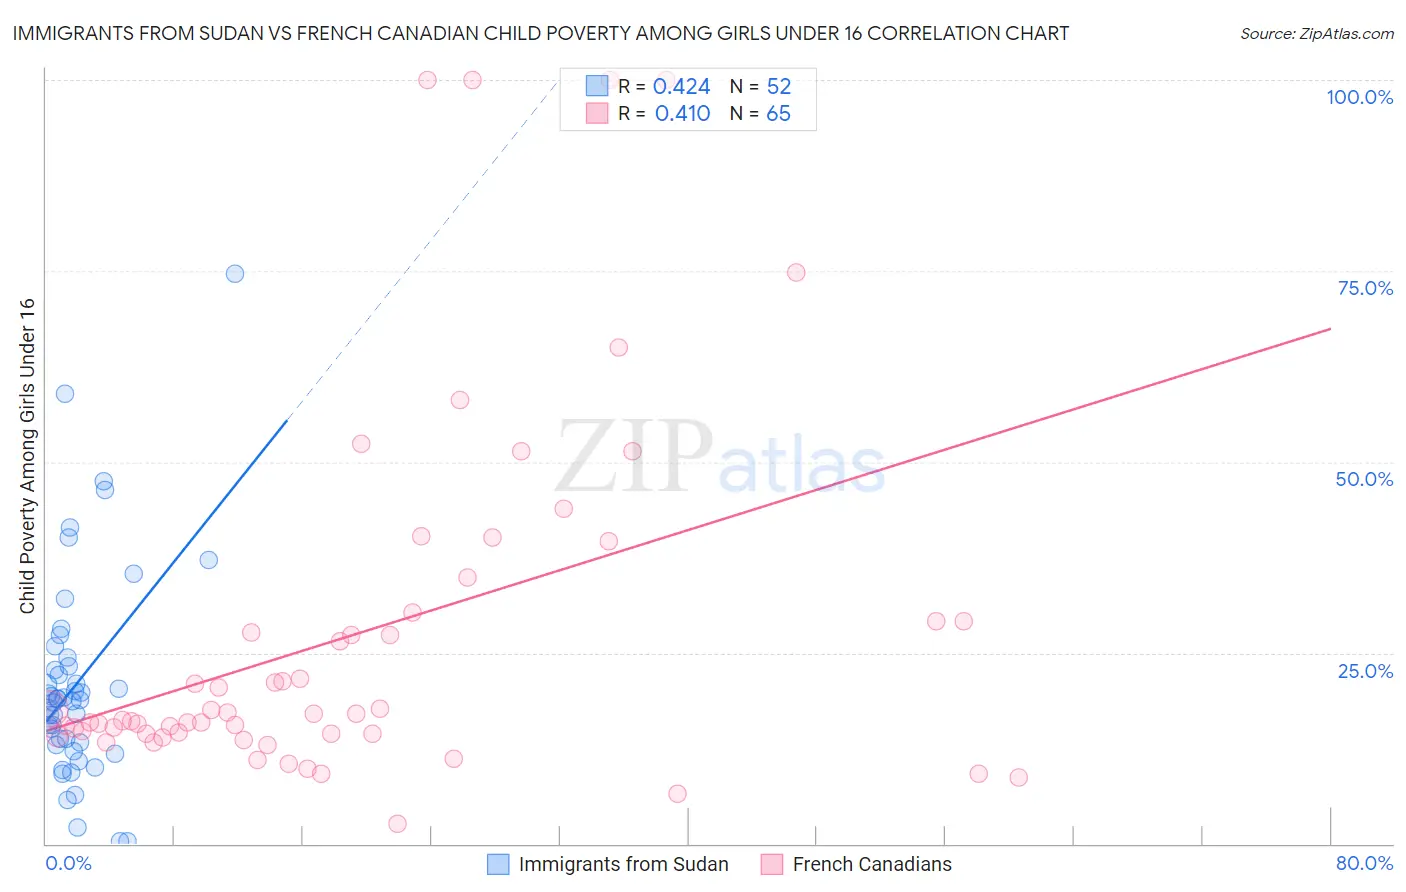
Immigrants from Sudan vs French Canadian Child Poverty Among Girls Under 16 Correlation Chart
The statistical analysis conducted on geographies consisting of 118,491,324 people shows a moderate positive correlation between the proportion of Immigrants from Sudan and poverty level among girls under the age of 16 in the United States with a correlation coefficient (R) of 0.424 and weighted average of 18.6%. Similarly, the statistical analysis conducted on geographies consisting of 487,191,826 people shows a moderate positive correlation between the proportion of French Canadians and poverty level among girls under the age of 16 in the United States with a correlation coefficient (R) of 0.410 and weighted average of 16.1%, a difference of 15.4%.
Child Poverty Among Girls Under 16 Correlation Summary
| Measurement | Immigrants from Sudan | French Canadian |
| Minimum | 0.37% | 2.6% |
| Maximum | 74.6% | 100.0% |
| Range | 74.2% | 97.4% |
| Mean | 21.1% | 27.4% |
| Median | 18.8% | 17.1% |
| Interquartile 25% (IQ1) | 13.1% | 14.4% |
| Interquartile 75% (IQ3) | 23.8% | 29.7% |
| Interquartile Range (IQR) | 10.7% | 15.3% |
| Standard Deviation (Sample) | 14.0% | 23.7% |
| Standard Deviation (Population) | 13.9% | 23.5% |
Similar Demographics by Child Poverty Among Girls Under 16
Demographics Similar to Immigrants from Sudan by Child Poverty Among Girls Under 16
In terms of child poverty among girls under 16, the demographic groups most similar to Immigrants from Sudan are Sudanese (18.6%, a difference of 0.040%), Fijian (18.6%, a difference of 0.11%), Nepalese (18.6%, a difference of 0.16%), Alsatian (18.6%, a difference of 0.17%), and Cree (18.5%, a difference of 0.24%).
| Demographics | Rating | Rank | Child Poverty Among Girls Under 16 |
| Immigrants | Africa | 2.7 /100 | #225 | Tragic 18.2% |
| Nicaraguans | 2.4 /100 | #226 | Tragic 18.2% |
| Immigrants | Nonimmigrants | 2.0 /100 | #227 | Tragic 18.3% |
| Alaskan Athabascans | 2.0 /100 | #228 | Tragic 18.3% |
| Ghanaians | 1.4 /100 | #229 | Tragic 18.5% |
| Osage | 1.3 /100 | #230 | Tragic 18.5% |
| Cree | 1.3 /100 | #231 | Tragic 18.5% |
| Immigrants | Sudan | 1.1 /100 | #232 | Tragic 18.6% |
| Sudanese | 1.1 /100 | #233 | Tragic 18.6% |
| Fijians | 1.1 /100 | #234 | Tragic 18.6% |
| Nepalese | 1.1 /100 | #235 | Tragic 18.6% |
| Alsatians | 1.1 /100 | #236 | Tragic 18.6% |
| Immigrants | Nigeria | 1.0 /100 | #237 | Tragic 18.6% |
| Immigrants | Eritrea | 1.0 /100 | #238 | Tragic 18.7% |
| Marshallese | 0.9 /100 | #239 | Tragic 18.7% |
Demographics Similar to French Canadians by Child Poverty Among Girls Under 16
In terms of child poverty among girls under 16, the demographic groups most similar to French Canadians are Immigrants from Oceania (16.1%, a difference of 0.050%), Immigrants from Colombia (16.1%, a difference of 0.11%), Immigrants from Germany (16.1%, a difference of 0.19%), South American (16.1%, a difference of 0.21%), and Immigrants from Northern Africa (16.0%, a difference of 0.47%).
| Demographics | Rating | Rank | Child Poverty Among Girls Under 16 |
| Syrians | 76.7 /100 | #155 | Good 15.9% |
| Immigrants | Fiji | 76.1 /100 | #156 | Good 15.9% |
| Colombians | 76.1 /100 | #157 | Good 15.9% |
| Guamanians/Chamorros | 75.3 /100 | #158 | Good 15.9% |
| Slovaks | 75.2 /100 | #159 | Good 15.9% |
| French | 72.8 /100 | #160 | Good 16.0% |
| Immigrants | Northern Africa | 72.0 /100 | #161 | Good 16.0% |
| French Canadians | 68.7 /100 | #162 | Good 16.1% |
| Immigrants | Oceania | 68.4 /100 | #163 | Good 16.1% |
| Immigrants | Colombia | 67.8 /100 | #164 | Good 16.1% |
| Immigrants | Germany | 67.3 /100 | #165 | Good 16.1% |
| South Americans | 67.2 /100 | #166 | Good 16.1% |
| Uruguayans | 64.7 /100 | #167 | Good 16.2% |
| Yugoslavians | 64.4 /100 | #168 | Good 16.2% |
| Costa Ricans | 64.2 /100 | #169 | Good 16.2% |