White/Caucasian vs Guamanian/Chamorro Seniors Poverty Over the Age of 65
COMPARE
White/Caucasian
Guamanian/Chamorro
Seniors Poverty Over the Age of 65
Seniors Poverty Over the Age of 65 Comparison
Whites/Caucasians
Guamanians/Chamorros
10.0%
SENIORS POVERTY OVER THE AGE OF 65
97.5/ 100
METRIC RATING
78th/ 347
METRIC RANK
10.5%
SENIORS POVERTY OVER THE AGE OF 65
87.5/ 100
METRIC RATING
133rd/ 347
METRIC RANK
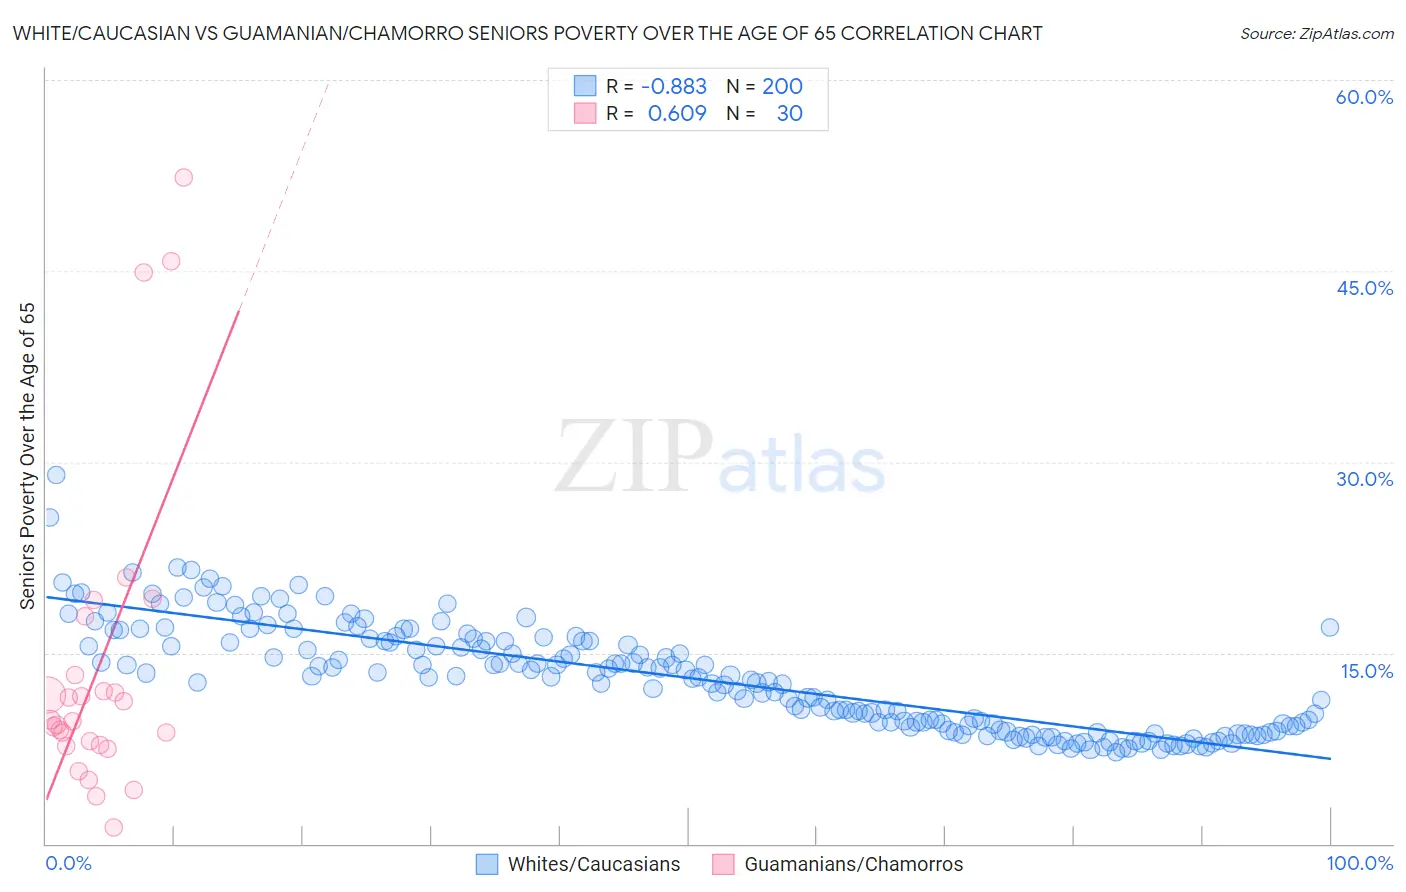
White/Caucasian vs Guamanian/Chamorro Seniors Poverty Over the Age of 65 Correlation Chart
The statistical analysis conducted on geographies consisting of 577,696,181 people shows a very strong negative correlation between the proportion of Whites/Caucasians and poverty level among seniors over the age of 65 in the United States with a correlation coefficient (R) of -0.883 and weighted average of 10.0%. Similarly, the statistical analysis conducted on geographies consisting of 221,115,754 people shows a significant positive correlation between the proportion of Guamanians/Chamorros and poverty level among seniors over the age of 65 in the United States with a correlation coefficient (R) of 0.609 and weighted average of 10.5%, a difference of 4.1%.
Seniors Poverty Over the Age of 65 Correlation Summary
| Measurement | White/Caucasian | Guamanian/Chamorro |
| Minimum | 7.2% | 1.2% |
| Maximum | 29.0% | 52.4% |
| Range | 21.8% | 51.1% |
| Mean | 13.0% | 13.9% |
| Median | 13.1% | 9.7% |
| Interquartile 25% (IQ1) | 9.2% | 7.7% |
| Interquartile 75% (IQ3) | 15.9% | 13.2% |
| Interquartile Range (IQR) | 6.7% | 5.5% |
| Standard Deviation (Sample) | 4.2% | 12.3% |
| Standard Deviation (Population) | 4.2% | 12.1% |
Similar Demographics by Seniors Poverty Over the Age of 65
Demographics Similar to Whites/Caucasians by Seniors Poverty Over the Age of 65
In terms of seniors poverty over the age of 65, the demographic groups most similar to Whites/Caucasians are Immigrants from Ireland (10.0%, a difference of 0.010%), Korean (10.1%, a difference of 0.11%), Immigrants from Sri Lanka (10.1%, a difference of 0.14%), Immigrants from Bolivia (10.1%, a difference of 0.21%), and Immigrants from South Africa (10.0%, a difference of 0.24%).
| Demographics | Rating | Rank | Seniors Poverty Over the Age of 65 |
| Yugoslavians | 97.9 /100 | #71 | Exceptional 10.0% |
| Palestinians | 97.9 /100 | #72 | Exceptional 10.0% |
| Russians | 97.9 /100 | #73 | Exceptional 10.0% |
| Turks | 97.9 /100 | #74 | Exceptional 10.0% |
| Immigrants | Czechoslovakia | 97.8 /100 | #75 | Exceptional 10.0% |
| New Zealanders | 97.7 /100 | #76 | Exceptional 10.0% |
| Immigrants | South Africa | 97.7 /100 | #77 | Exceptional 10.0% |
| Whites/Caucasians | 97.5 /100 | #78 | Exceptional 10.0% |
| Immigrants | Ireland | 97.5 /100 | #79 | Exceptional 10.0% |
| Koreans | 97.4 /100 | #80 | Exceptional 10.1% |
| Immigrants | Sri Lanka | 97.3 /100 | #81 | Exceptional 10.1% |
| Immigrants | Bolivia | 97.3 /100 | #82 | Exceptional 10.1% |
| Immigrants | Poland | 97.2 /100 | #83 | Exceptional 10.1% |
| Immigrants | Afghanistan | 97.2 /100 | #84 | Exceptional 10.1% |
| Immigrants | Nepal | 97.2 /100 | #85 | Exceptional 10.1% |
Demographics Similar to Guamanians/Chamorros by Seniors Poverty Over the Age of 65
In terms of seniors poverty over the age of 65, the demographic groups most similar to Guamanians/Chamorros are Immigrants from Turkey (10.5%, a difference of 0.040%), Egyptian (10.5%, a difference of 0.050%), Sierra Leonean (10.5%, a difference of 0.15%), Immigrants from Iran (10.4%, a difference of 0.20%), and Immigrants from Oceania (10.4%, a difference of 0.20%).
| Demographics | Rating | Rank | Seniors Poverty Over the Age of 65 |
| Immigrants | Hungary | 89.1 /100 | #126 | Excellent 10.4% |
| Cambodians | 89.1 /100 | #127 | Excellent 10.4% |
| Ottawa | 88.5 /100 | #128 | Excellent 10.4% |
| Immigrants | Iran | 88.4 /100 | #129 | Excellent 10.4% |
| Immigrants | Oceania | 88.4 /100 | #130 | Excellent 10.4% |
| Egyptians | 87.8 /100 | #131 | Excellent 10.5% |
| Immigrants | Turkey | 87.7 /100 | #132 | Excellent 10.5% |
| Guamanians/Chamorros | 87.5 /100 | #133 | Excellent 10.5% |
| Sierra Leoneans | 86.8 /100 | #134 | Excellent 10.5% |
| Immigrants | Norway | 86.5 /100 | #135 | Excellent 10.5% |
| Immigrants | Serbia | 86.4 /100 | #136 | Excellent 10.5% |
| Immigrants | Australia | 85.1 /100 | #137 | Excellent 10.5% |
| Immigrants | Latvia | 84.7 /100 | #138 | Excellent 10.5% |
| Portuguese | 84.1 /100 | #139 | Excellent 10.5% |
| Immigrants | Kenya | 83.4 /100 | #140 | Excellent 10.5% |