Puerto Rican vs Immigrants from Malaysia Seniors Poverty Over the Age of 65
COMPARE
Puerto Rican
Immigrants from Malaysia
Seniors Poverty Over the Age of 65
Seniors Poverty Over the Age of 65 Comparison
Puerto Ricans
Immigrants from Malaysia
21.4%
SENIORS POVERTY OVER THE AGE OF 65
0.0/ 100
METRIC RATING
347th/ 347
METRIC RANK
11.0%
SENIORS POVERTY OVER THE AGE OF 65
47.9/ 100
METRIC RATING
176th/ 347
METRIC RANK
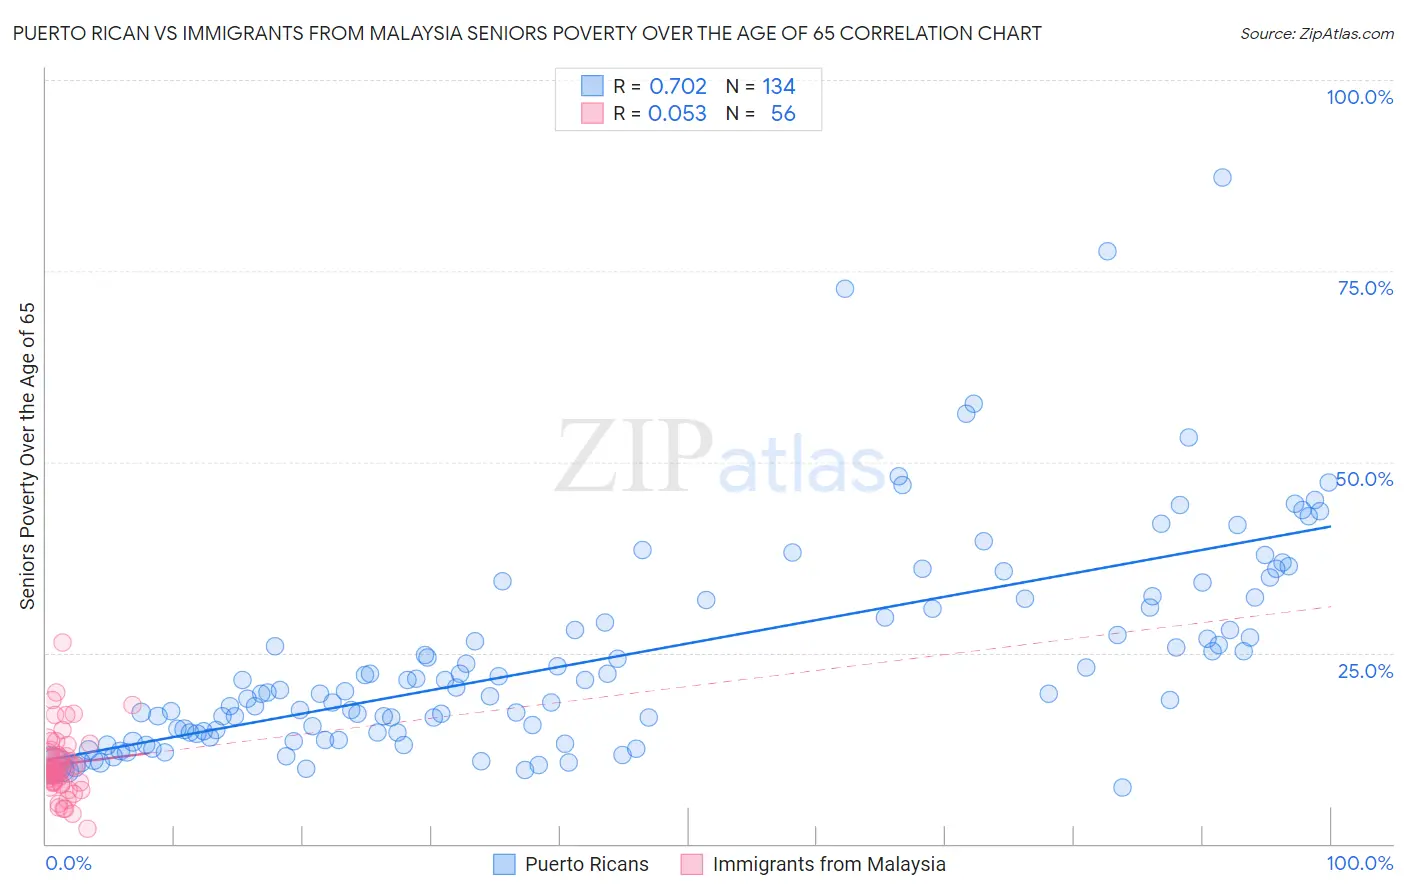
Puerto Rican vs Immigrants from Malaysia Seniors Poverty Over the Age of 65 Correlation Chart
The statistical analysis conducted on geographies consisting of 524,803,283 people shows a strong positive correlation between the proportion of Puerto Ricans and poverty level among seniors over the age of 65 in the United States with a correlation coefficient (R) of 0.702 and weighted average of 21.4%. Similarly, the statistical analysis conducted on geographies consisting of 197,703,673 people shows a slight positive correlation between the proportion of Immigrants from Malaysia and poverty level among seniors over the age of 65 in the United States with a correlation coefficient (R) of 0.053 and weighted average of 11.0%, a difference of 95.4%.
Seniors Poverty Over the Age of 65 Correlation Summary
| Measurement | Puerto Rican | Immigrants from Malaysia |
| Minimum | 7.4% | 1.9% |
| Maximum | 87.3% | 26.4% |
| Range | 79.9% | 24.5% |
| Mean | 24.3% | 10.4% |
| Median | 19.9% | 9.8% |
| Interquartile 25% (IQ1) | 14.5% | 8.1% |
| Interquartile 75% (IQ3) | 30.9% | 12.0% |
| Interquartile Range (IQR) | 16.3% | 3.9% |
| Standard Deviation (Sample) | 14.1% | 4.3% |
| Standard Deviation (Population) | 14.0% | 4.3% |
Similar Demographics by Seniors Poverty Over the Age of 65
Demographics Similar to Puerto Ricans by Seniors Poverty Over the Age of 65
In terms of seniors poverty over the age of 65, the demographic groups most similar to Puerto Ricans are Tohono O'odham (20.8%, a difference of 2.7%), Pima (19.8%, a difference of 8.1%), Immigrants from Dominican Republic (18.3%, a difference of 17.0%), Lumbee (18.1%, a difference of 18.1%), and Immigrants from Cuba (17.9%, a difference of 19.4%).
| Demographics | Rating | Rank | Seniors Poverty Over the Age of 65 |
| Immigrants | Yemen | 0.0 /100 | #333 | Tragic 15.9% |
| Immigrants | Nicaragua | 0.0 /100 | #334 | Tragic 15.9% |
| Cubans | 0.0 /100 | #335 | Tragic 16.1% |
| Immigrants | Cabo Verde | 0.0 /100 | #336 | Tragic 16.2% |
| Immigrants | Caribbean | 0.0 /100 | #337 | Tragic 16.5% |
| Pueblo | 0.0 /100 | #338 | Tragic 17.2% |
| Navajo | 0.0 /100 | #339 | Tragic 17.5% |
| Hopi | 0.0 /100 | #340 | Tragic 17.8% |
| Dominicans | 0.0 /100 | #341 | Tragic 17.8% |
| Immigrants | Cuba | 0.0 /100 | #342 | Tragic 17.9% |
| Lumbee | 0.0 /100 | #343 | Tragic 18.1% |
| Immigrants | Dominican Republic | 0.0 /100 | #344 | Tragic 18.3% |
| Pima | 0.0 /100 | #345 | Tragic 19.8% |
| Tohono O'odham | 0.0 /100 | #346 | Tragic 20.8% |
| Puerto Ricans | 0.0 /100 | #347 | Tragic 21.4% |
Demographics Similar to Immigrants from Malaysia by Seniors Poverty Over the Age of 65
In terms of seniors poverty over the age of 65, the demographic groups most similar to Immigrants from Malaysia are Cherokee (11.0%, a difference of 0.050%), German Russian (11.0%, a difference of 0.090%), Creek (10.9%, a difference of 0.15%), Immigrants from Sudan (10.9%, a difference of 0.19%), and Spaniard (10.9%, a difference of 0.25%).
| Demographics | Rating | Rank | Seniors Poverty Over the Age of 65 |
| Sri Lankans | 56.8 /100 | #169 | Average 10.9% |
| Immigrants | Eastern Europe | 55.8 /100 | #170 | Average 10.9% |
| Immigrants | Nonimmigrants | 55.1 /100 | #171 | Average 10.9% |
| Immigrants | Syria | 54.7 /100 | #172 | Average 10.9% |
| Spaniards | 50.7 /100 | #173 | Average 10.9% |
| Immigrants | Sudan | 50.0 /100 | #174 | Average 10.9% |
| Creek | 49.6 /100 | #175 | Average 10.9% |
| Immigrants | Malaysia | 47.9 /100 | #176 | Average 11.0% |
| Cherokee | 47.3 /100 | #177 | Average 11.0% |
| German Russians | 46.9 /100 | #178 | Average 11.0% |
| Immigrants | Northern Africa | 44.6 /100 | #179 | Average 11.0% |
| Immigrants | Thailand | 43.5 /100 | #180 | Average 11.0% |
| Immigrants | Eastern Africa | 43.4 /100 | #181 | Average 11.0% |
| Immigrants | Fiji | 42.0 /100 | #182 | Average 11.0% |
| Immigrants | Kazakhstan | 41.0 /100 | #183 | Average 11.0% |