Puerto Rican vs European Family Poverty
COMPARE
Puerto Rican
European
Family Poverty
Family Poverty Comparison
Puerto Ricans
Europeans
20.3%
FAMILY POVERTY
0.0/ 100
METRIC RATING
346th/ 347
METRIC RANK
7.7%
FAMILY POVERTY
98.7/ 100
METRIC RATING
59th/ 347
METRIC RANK
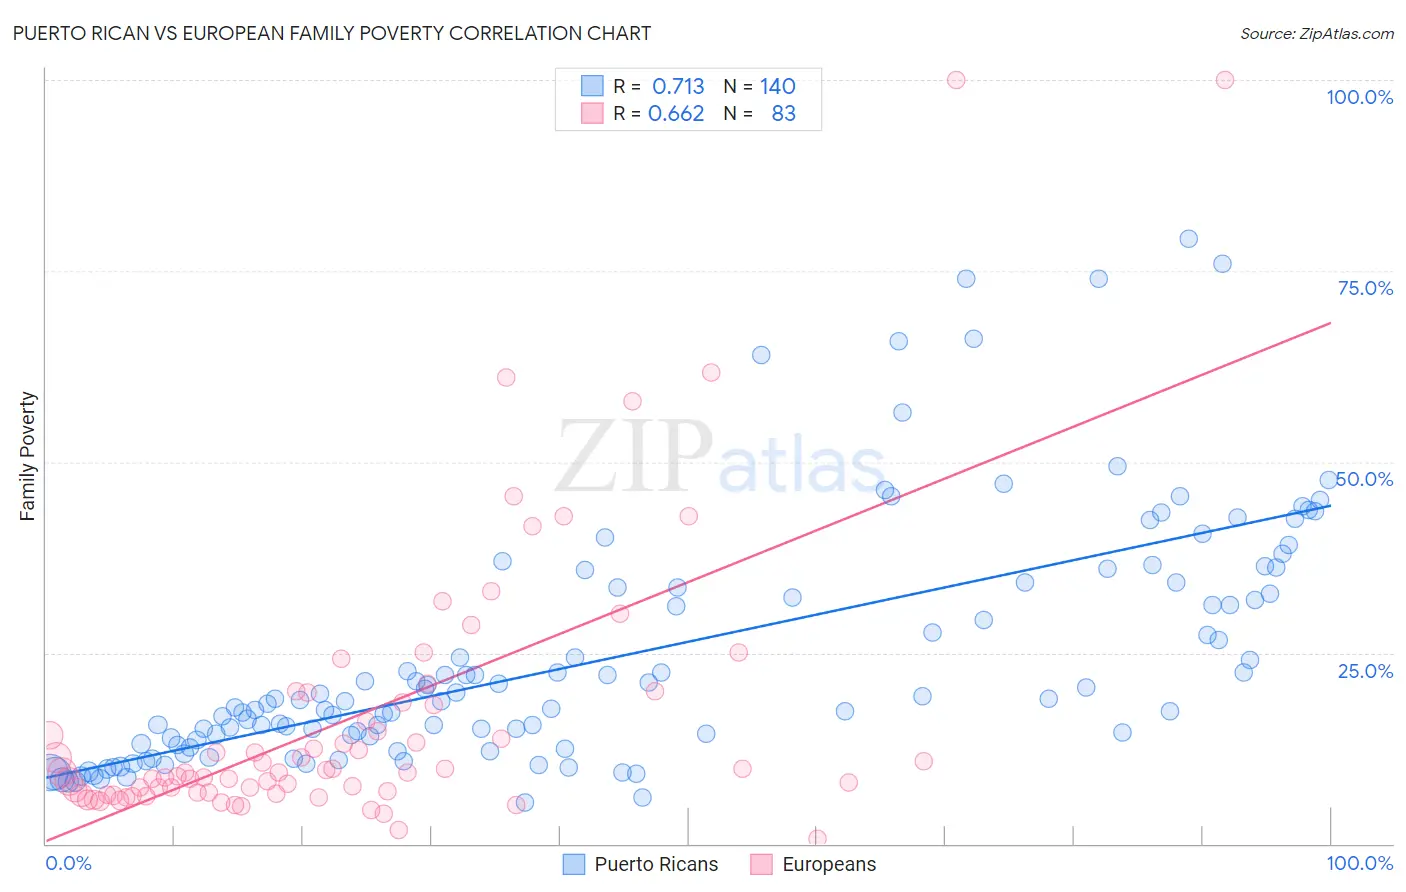
Puerto Rican vs European Family Poverty Correlation Chart
The statistical analysis conducted on geographies consisting of 525,427,340 people shows a strong positive correlation between the proportion of Puerto Ricans and poverty level among families in the United States with a correlation coefficient (R) of 0.713 and weighted average of 20.3%. Similarly, the statistical analysis conducted on geographies consisting of 557,705,193 people shows a significant positive correlation between the proportion of Europeans and poverty level among families in the United States with a correlation coefficient (R) of 0.662 and weighted average of 7.7%, a difference of 162.8%.
Family Poverty Correlation Summary
| Measurement | Puerto Rican | European |
| Minimum | 5.3% | 0.65% |
| Maximum | 79.2% | 100.0% |
| Range | 73.9% | 99.4% |
| Mean | 24.4% | 16.6% |
| Median | 18.7% | 9.3% |
| Interquartile 25% (IQ1) | 13.3% | 6.7% |
| Interquartile 75% (IQ3) | 33.5% | 18.4% |
| Interquartile Range (IQR) | 20.2% | 11.8% |
| Standard Deviation (Sample) | 15.9% | 18.6% |
| Standard Deviation (Population) | 15.9% | 18.5% |
Similar Demographics by Family Poverty
Demographics Similar to Puerto Ricans by Family Poverty
In terms of family poverty, the demographic groups most similar to Puerto Ricans are Tohono O'odham (20.4%, a difference of 0.37%), Navajo (18.8%, a difference of 8.1%), Yup'ik (18.7%, a difference of 8.6%), Pima (18.4%, a difference of 10.6%), and Immigrants from Yemen (17.5%, a difference of 16.4%).
| Demographics | Rating | Rank | Family Poverty |
| Immigrants | Dominican Republic | 0.0 /100 | #333 | Tragic 14.4% |
| Houma | 0.0 /100 | #334 | Tragic 14.6% |
| Apache | 0.0 /100 | #335 | Tragic 14.7% |
| Sioux | 0.0 /100 | #336 | Tragic 15.9% |
| Hopi | 0.0 /100 | #337 | Tragic 15.9% |
| Crow | 0.0 /100 | #338 | Tragic 16.1% |
| Yuman | 0.0 /100 | #339 | Tragic 16.6% |
| Pueblo | 0.0 /100 | #340 | Tragic 17.0% |
| Lumbee | 0.0 /100 | #341 | Tragic 17.0% |
| Immigrants | Yemen | 0.0 /100 | #342 | Tragic 17.5% |
| Pima | 0.0 /100 | #343 | Tragic 18.4% |
| Yup'ik | 0.0 /100 | #344 | Tragic 18.7% |
| Navajo | 0.0 /100 | #345 | Tragic 18.8% |
| Puerto Ricans | 0.0 /100 | #346 | Tragic 20.3% |
| Tohono O'odham | 0.0 /100 | #347 | Tragic 20.4% |
Demographics Similar to Europeans by Family Poverty
In terms of family poverty, the demographic groups most similar to Europeans are Finnish (7.7%, a difference of 0.010%), Immigrants from Greece (7.7%, a difference of 0.010%), Asian (7.7%, a difference of 0.040%), Immigrants from Serbia (7.7%, a difference of 0.13%), and Immigrants from Eastern Asia (7.7%, a difference of 0.17%).
| Demographics | Rating | Rank | Family Poverty |
| Indians (Asian) | 98.8 /100 | #52 | Exceptional 7.7% |
| Swiss | 98.8 /100 | #53 | Exceptional 7.7% |
| Immigrants | Sweden | 98.8 /100 | #54 | Exceptional 7.7% |
| Immigrants | Eastern Asia | 98.7 /100 | #55 | Exceptional 7.7% |
| Immigrants | Serbia | 98.7 /100 | #56 | Exceptional 7.7% |
| Asians | 98.7 /100 | #57 | Exceptional 7.7% |
| Finns | 98.7 /100 | #58 | Exceptional 7.7% |
| Europeans | 98.7 /100 | #59 | Exceptional 7.7% |
| Immigrants | Greece | 98.7 /100 | #60 | Exceptional 7.7% |
| Immigrants | Netherlands | 98.6 /100 | #61 | Exceptional 7.7% |
| Macedonians | 98.6 /100 | #62 | Exceptional 7.8% |
| Zimbabweans | 98.4 /100 | #63 | Exceptional 7.8% |
| Koreans | 98.3 /100 | #64 | Exceptional 7.8% |
| Immigrants | Bulgaria | 98.3 /100 | #65 | Exceptional 7.8% |
| Dutch | 98.3 /100 | #66 | Exceptional 7.8% |