Puerto Rican vs European Unemployment Among Women with Children Under 6 years
COMPARE
Puerto Rican
European
Unemployment Among Women with Children Under 6 years
Unemployment Among Women with Children Under 6 years Comparison
Puerto Ricans
Europeans
12.5%
UNEMPLOYMENT AMONG WOMEN WITH CHILDREN UNDER 6 YEARS
0.0/ 100
METRIC RATING
335th/ 347
METRIC RANK
7.5%
UNEMPLOYMENT AMONG WOMEN WITH CHILDREN UNDER 6 YEARS
79.1/ 100
METRIC RATING
144th/ 347
METRIC RANK
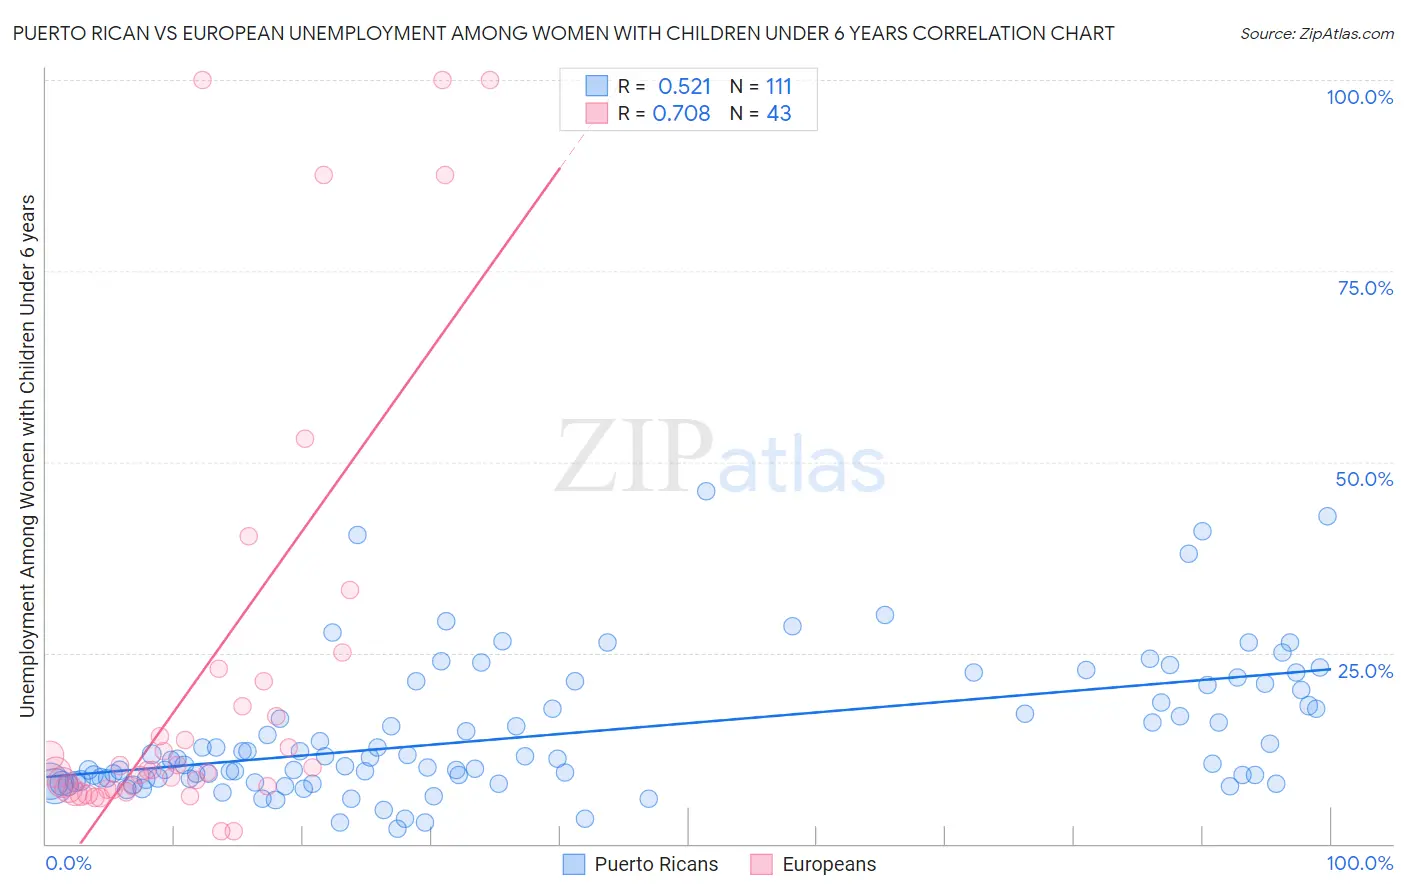
Puerto Rican vs European Unemployment Among Women with Children Under 6 years Correlation Chart
The statistical analysis conducted on geographies consisting of 369,552,119 people shows a substantial positive correlation between the proportion of Puerto Ricans and unemployment rate among women with children under the age of 6 in the United States with a correlation coefficient (R) of 0.521 and weighted average of 12.5%. Similarly, the statistical analysis conducted on geographies consisting of 373,796,312 people shows a strong positive correlation between the proportion of Europeans and unemployment rate among women with children under the age of 6 in the United States with a correlation coefficient (R) of 0.708 and weighted average of 7.5%, a difference of 67.8%.
Unemployment Among Women with Children Under 6 years Correlation Summary
| Measurement | Puerto Rican | European |
| Minimum | 2.0% | 1.6% |
| Maximum | 46.2% | 100.0% |
| Range | 44.2% | 98.4% |
| Mean | 14.4% | 22.3% |
| Median | 11.1% | 9.7% |
| Interquartile 25% (IQ1) | 8.3% | 7.2% |
| Interquartile 75% (IQ3) | 20.1% | 21.3% |
| Interquartile Range (IQR) | 11.9% | 14.1% |
| Standard Deviation (Sample) | 9.0% | 28.5% |
| Standard Deviation (Population) | 9.0% | 28.2% |
Similar Demographics by Unemployment Among Women with Children Under 6 years
Demographics Similar to Puerto Ricans by Unemployment Among Women with Children Under 6 years
In terms of unemployment among women with children under 6 years, the demographic groups most similar to Puerto Ricans are Apache (12.3%, a difference of 1.8%), Shoshone (13.2%, a difference of 5.1%), Chippewa (13.3%, a difference of 6.3%), Pima (13.4%, a difference of 7.1%), and Navajo (13.5%, a difference of 7.5%).
| Demographics | Rating | Rank | Unemployment Among Women with Children Under 6 years |
| Tohono O'odham | 0.0 /100 | #328 | Tragic 10.2% |
| Blacks/African Americans | 0.0 /100 | #329 | Tragic 10.3% |
| Pennsylvania Germans | 0.0 /100 | #330 | Tragic 10.8% |
| Colville | 0.0 /100 | #331 | Tragic 11.2% |
| Sioux | 0.0 /100 | #332 | Tragic 11.5% |
| Natives/Alaskans | 0.0 /100 | #333 | Tragic 11.5% |
| Apache | 0.0 /100 | #334 | Tragic 12.3% |
| Puerto Ricans | 0.0 /100 | #335 | Tragic 12.5% |
| Shoshone | 0.0 /100 | #336 | Tragic 13.2% |
| Chippewa | 0.0 /100 | #337 | Tragic 13.3% |
| Pima | 0.0 /100 | #338 | Tragic 13.4% |
| Navajo | 0.0 /100 | #339 | Tragic 13.5% |
| Immigrants | Yemen | 0.0 /100 | #340 | Tragic 13.5% |
| Lumbee | 0.0 /100 | #341 | Tragic 13.8% |
| Yuman | 0.0 /100 | #342 | Tragic 14.6% |
Demographics Similar to Europeans by Unemployment Among Women with Children Under 6 years
In terms of unemployment among women with children under 6 years, the demographic groups most similar to Europeans are Immigrants from Jordan (7.5%, a difference of 0.030%), Japanese (7.5%, a difference of 0.030%), Immigrants from Oceania (7.5%, a difference of 0.070%), Immigrants from Brazil (7.5%, a difference of 0.18%), and Korean (7.5%, a difference of 0.24%).
| Demographics | Rating | Rank | Unemployment Among Women with Children Under 6 years |
| Immigrants | Cambodia | 84.6 /100 | #137 | Excellent 7.4% |
| Immigrants | Norway | 84.1 /100 | #138 | Excellent 7.4% |
| Immigrants | Colombia | 83.9 /100 | #139 | Excellent 7.4% |
| Scandinavians | 83.0 /100 | #140 | Excellent 7.4% |
| Greeks | 82.6 /100 | #141 | Excellent 7.4% |
| Immigrants | Argentina | 81.5 /100 | #142 | Excellent 7.5% |
| Koreans | 81.3 /100 | #143 | Excellent 7.5% |
| Europeans | 79.1 /100 | #144 | Good 7.5% |
| Immigrants | Jordan | 78.9 /100 | #145 | Good 7.5% |
| Japanese | 78.9 /100 | #146 | Good 7.5% |
| Immigrants | Oceania | 78.4 /100 | #147 | Good 7.5% |
| Immigrants | Brazil | 77.3 /100 | #148 | Good 7.5% |
| Colombians | 76.1 /100 | #149 | Good 7.5% |
| Aleuts | 76.0 /100 | #150 | Good 7.5% |
| Immigrants | Peru | 74.9 /100 | #151 | Good 7.5% |