Puerto Rican vs Cypriot Family Poverty
COMPARE
Puerto Rican
Cypriot
Family Poverty
Family Poverty Comparison
Puerto Ricans
Cypriots
20.3%
FAMILY POVERTY
0.0/ 100
METRIC RATING
346th/ 347
METRIC RANK
7.3%
FAMILY POVERTY
99.6/ 100
METRIC RATING
26th/ 347
METRIC RANK
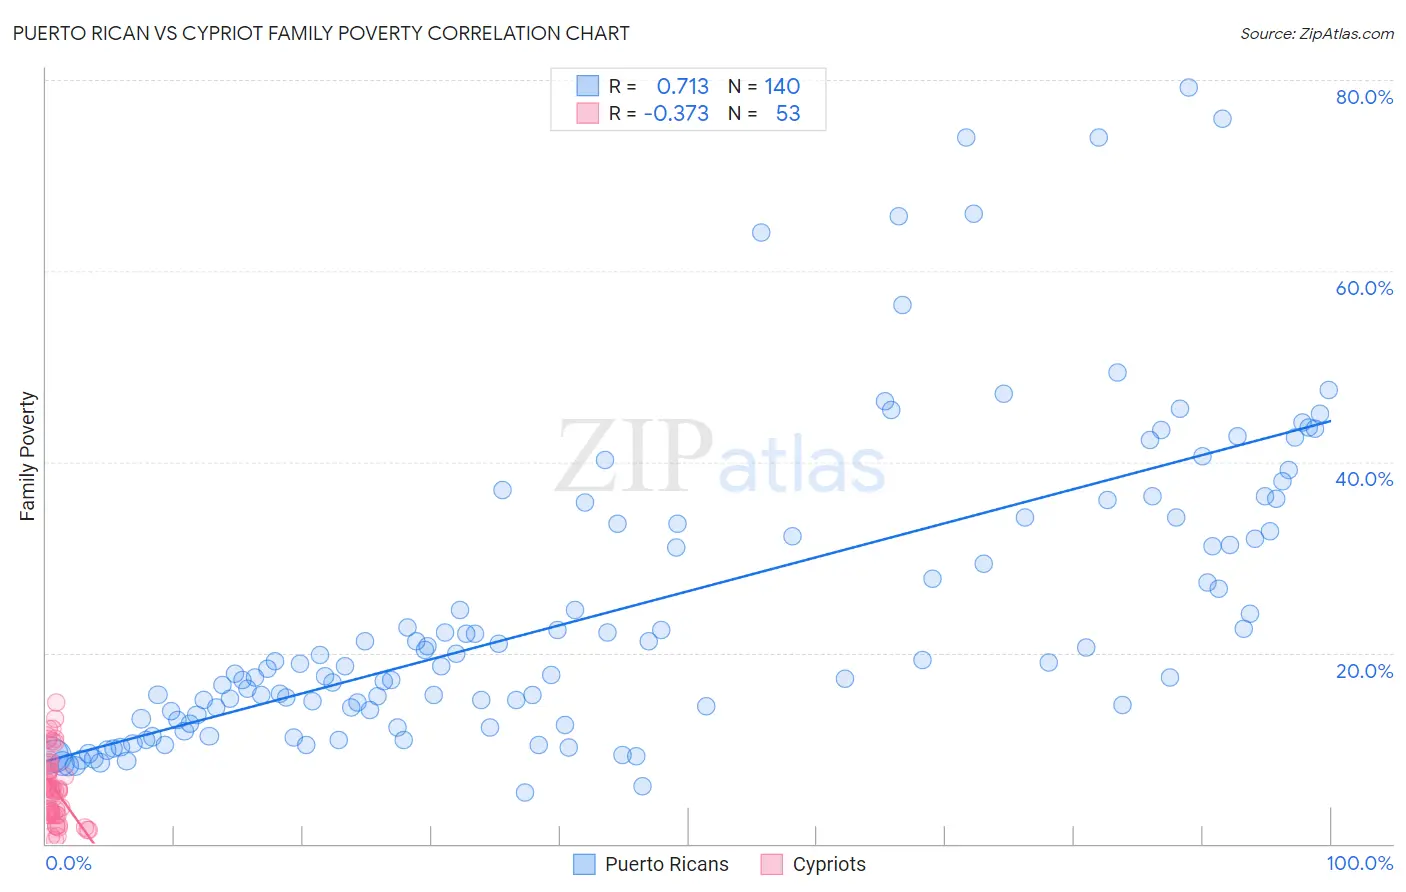
Puerto Rican vs Cypriot Family Poverty Correlation Chart
The statistical analysis conducted on geographies consisting of 525,427,340 people shows a strong positive correlation between the proportion of Puerto Ricans and poverty level among families in the United States with a correlation coefficient (R) of 0.713 and weighted average of 20.3%. Similarly, the statistical analysis conducted on geographies consisting of 61,784,976 people shows a mild negative correlation between the proportion of Cypriots and poverty level among families in the United States with a correlation coefficient (R) of -0.373 and weighted average of 7.3%, a difference of 176.8%.
Family Poverty Correlation Summary
| Measurement | Puerto Rican | Cypriot |
| Minimum | 5.3% | 0.41% |
| Maximum | 79.2% | 14.8% |
| Range | 73.9% | 14.4% |
| Mean | 24.4% | 5.8% |
| Median | 18.7% | 5.6% |
| Interquartile 25% (IQ1) | 13.3% | 3.1% |
| Interquartile 75% (IQ3) | 33.5% | 7.9% |
| Interquartile Range (IQR) | 20.2% | 4.9% |
| Standard Deviation (Sample) | 15.9% | 3.6% |
| Standard Deviation (Population) | 15.9% | 3.5% |
Similar Demographics by Family Poverty
Demographics Similar to Puerto Ricans by Family Poverty
In terms of family poverty, the demographic groups most similar to Puerto Ricans are Tohono O'odham (20.4%, a difference of 0.37%), Navajo (18.8%, a difference of 8.1%), Yup'ik (18.7%, a difference of 8.6%), Pima (18.4%, a difference of 10.6%), and Immigrants from Yemen (17.5%, a difference of 16.4%).
| Demographics | Rating | Rank | Family Poverty |
| Immigrants | Dominican Republic | 0.0 /100 | #333 | Tragic 14.4% |
| Houma | 0.0 /100 | #334 | Tragic 14.6% |
| Apache | 0.0 /100 | #335 | Tragic 14.7% |
| Sioux | 0.0 /100 | #336 | Tragic 15.9% |
| Hopi | 0.0 /100 | #337 | Tragic 15.9% |
| Crow | 0.0 /100 | #338 | Tragic 16.1% |
| Yuman | 0.0 /100 | #339 | Tragic 16.6% |
| Pueblo | 0.0 /100 | #340 | Tragic 17.0% |
| Lumbee | 0.0 /100 | #341 | Tragic 17.0% |
| Immigrants | Yemen | 0.0 /100 | #342 | Tragic 17.5% |
| Pima | 0.0 /100 | #343 | Tragic 18.4% |
| Yup'ik | 0.0 /100 | #344 | Tragic 18.7% |
| Navajo | 0.0 /100 | #345 | Tragic 18.8% |
| Puerto Ricans | 0.0 /100 | #346 | Tragic 20.3% |
| Tohono O'odham | 0.0 /100 | #347 | Tragic 20.4% |
Demographics Similar to Cypriots by Family Poverty
In terms of family poverty, the demographic groups most similar to Cypriots are Immigrants from Scotland (7.3%, a difference of 0.020%), Burmese (7.3%, a difference of 0.24%), Croatian (7.3%, a difference of 0.25%), Immigrants from Korea (7.4%, a difference of 0.40%), and Assyrian/Chaldean/Syriac (7.3%, a difference of 0.55%).
| Demographics | Rating | Rank | Family Poverty |
| Eastern Europeans | 99.7 /100 | #19 | Exceptional 7.2% |
| Immigrants | Hong Kong | 99.7 /100 | #20 | Exceptional 7.3% |
| Immigrants | Iran | 99.7 /100 | #21 | Exceptional 7.3% |
| Danes | 99.7 /100 | #22 | Exceptional 7.3% |
| Assyrians/Chaldeans/Syriacs | 99.7 /100 | #23 | Exceptional 7.3% |
| Croatians | 99.7 /100 | #24 | Exceptional 7.3% |
| Burmese | 99.7 /100 | #25 | Exceptional 7.3% |
| Cypriots | 99.6 /100 | #26 | Exceptional 7.3% |
| Immigrants | Scotland | 99.6 /100 | #27 | Exceptional 7.3% |
| Immigrants | Korea | 99.6 /100 | #28 | Exceptional 7.4% |
| Immigrants | Northern Europe | 99.6 /100 | #29 | Exceptional 7.4% |
| Italians | 99.6 /100 | #30 | Exceptional 7.4% |
| Czechs | 99.6 /100 | #31 | Exceptional 7.4% |
| Poles | 99.5 /100 | #32 | Exceptional 7.4% |
| Immigrants | Japan | 99.5 /100 | #33 | Exceptional 7.4% |