Potawatomi vs Blackfeet Male Poverty
COMPARE
Potawatomi
Blackfeet
Male Poverty
Male Poverty Comparison
Potawatomi
Blackfeet
12.9%
MALE POVERTY
0.2/ 100
METRIC RATING
249th/ 347
METRIC RANK
14.0%
MALE POVERTY
0.0/ 100
METRIC RATING
298th/ 347
METRIC RANK
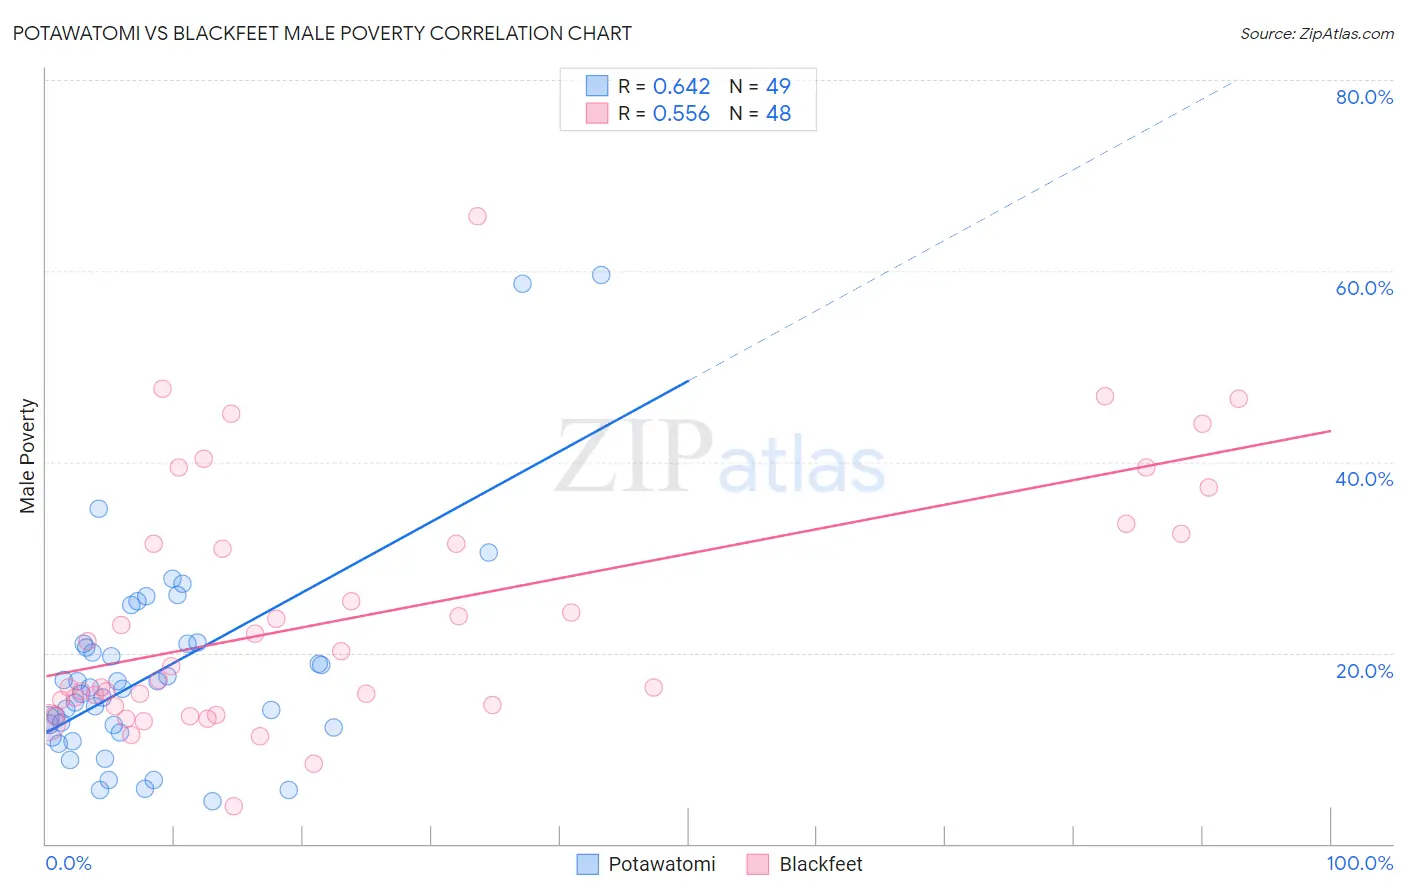
Potawatomi vs Blackfeet Male Poverty Correlation Chart
The statistical analysis conducted on geographies consisting of 117,745,310 people shows a significant positive correlation between the proportion of Potawatomi and poverty level among males in the United States with a correlation coefficient (R) of 0.642 and weighted average of 12.9%. Similarly, the statistical analysis conducted on geographies consisting of 309,436,017 people shows a substantial positive correlation between the proportion of Blackfeet and poverty level among males in the United States with a correlation coefficient (R) of 0.556 and weighted average of 14.0%, a difference of 8.5%.
Male Poverty Correlation Summary
| Measurement | Potawatomi | Blackfeet |
| Minimum | 4.4% | 3.9% |
| Maximum | 59.6% | 65.7% |
| Range | 55.1% | 61.8% |
| Mean | 18.0% | 23.9% |
| Median | 16.2% | 17.9% |
| Interquartile 25% (IQ1) | 11.9% | 14.4% |
| Interquartile 75% (IQ3) | 21.0% | 31.9% |
| Interquartile Range (IQR) | 9.1% | 17.5% |
| Standard Deviation (Sample) | 11.0% | 13.2% |
| Standard Deviation (Population) | 10.9% | 13.0% |
Similar Demographics by Male Poverty
Demographics Similar to Potawatomi by Male Poverty
In terms of male poverty, the demographic groups most similar to Potawatomi are Immigrants from Nicaragua (12.9%, a difference of 0.010%), Immigrants from Sudan (12.9%, a difference of 0.070%), Immigrants from Cuba (12.9%, a difference of 0.11%), Immigrants from Western Africa (12.9%, a difference of 0.13%), and Immigrants from Ecuador (12.9%, a difference of 0.14%).
| Demographics | Rating | Rank | Male Poverty |
| Nepalese | 0.3 /100 | #242 | Tragic 12.8% |
| Alaskan Athabascans | 0.3 /100 | #243 | Tragic 12.8% |
| Tsimshian | 0.3 /100 | #244 | Tragic 12.8% |
| Liberians | 0.3 /100 | #245 | Tragic 12.8% |
| Immigrants | El Salvador | 0.2 /100 | #246 | Tragic 12.8% |
| Immigrants | Western Africa | 0.2 /100 | #247 | Tragic 12.9% |
| Immigrants | Sudan | 0.2 /100 | #248 | Tragic 12.9% |
| Potawatomi | 0.2 /100 | #249 | Tragic 12.9% |
| Immigrants | Nicaragua | 0.2 /100 | #250 | Tragic 12.9% |
| Immigrants | Cuba | 0.2 /100 | #251 | Tragic 12.9% |
| Immigrants | Ecuador | 0.2 /100 | #252 | Tragic 12.9% |
| Immigrants | Ghana | 0.2 /100 | #253 | Tragic 12.9% |
| Mexican American Indians | 0.1 /100 | #254 | Tragic 13.0% |
| Immigrants | Liberia | 0.1 /100 | #255 | Tragic 13.0% |
| Immigrants | Burma/Myanmar | 0.1 /100 | #256 | Tragic 13.0% |
Demographics Similar to Blackfeet by Male Poverty
In terms of male poverty, the demographic groups most similar to Blackfeet are Inupiat (14.0%, a difference of 0.030%), Immigrants from Guatemala (14.0%, a difference of 0.10%), Immigrants from Mexico (14.0%, a difference of 0.22%), Immigrants from Senegal (14.0%, a difference of 0.29%), and Immigrants from Caribbean (14.0%, a difference of 0.34%).
| Demographics | Rating | Rank | Male Poverty |
| Vietnamese | 0.0 /100 | #291 | Tragic 13.8% |
| Indonesians | 0.0 /100 | #292 | Tragic 13.8% |
| Immigrants | Belize | 0.0 /100 | #293 | Tragic 13.8% |
| Hispanics or Latinos | 0.0 /100 | #294 | Tragic 13.9% |
| Immigrants | Central America | 0.0 /100 | #295 | Tragic 13.9% |
| Cajuns | 0.0 /100 | #296 | Tragic 13.9% |
| Inupiat | 0.0 /100 | #297 | Tragic 14.0% |
| Blackfeet | 0.0 /100 | #298 | Tragic 14.0% |
| Immigrants | Guatemala | 0.0 /100 | #299 | Tragic 14.0% |
| Immigrants | Mexico | 0.0 /100 | #300 | Tragic 14.0% |
| Immigrants | Senegal | 0.0 /100 | #301 | Tragic 14.0% |
| Immigrants | Caribbean | 0.0 /100 | #302 | Tragic 14.0% |
| Bahamians | 0.0 /100 | #303 | Tragic 14.1% |
| Senegalese | 0.0 /100 | #304 | Tragic 14.1% |
| Immigrants | Bangladesh | 0.0 /100 | #305 | Tragic 14.1% |