Potawatomi vs Eastern European Female Poverty Among 18-24 Year Olds
COMPARE
Potawatomi
Eastern European
Female Poverty Among 18-24 Year Olds
Female Poverty Among 18-24 Year Olds Comparison
Potawatomi
Eastern Europeans
23.7%
FEMALE POVERTY AMONG 18-24 YEAR OLDS
0.0/ 100
METRIC RATING
311th/ 347
METRIC RANK
19.9%
FEMALE POVERTY AMONG 18-24 YEAR OLDS
69.3/ 100
METRIC RATING
165th/ 347
METRIC RANK
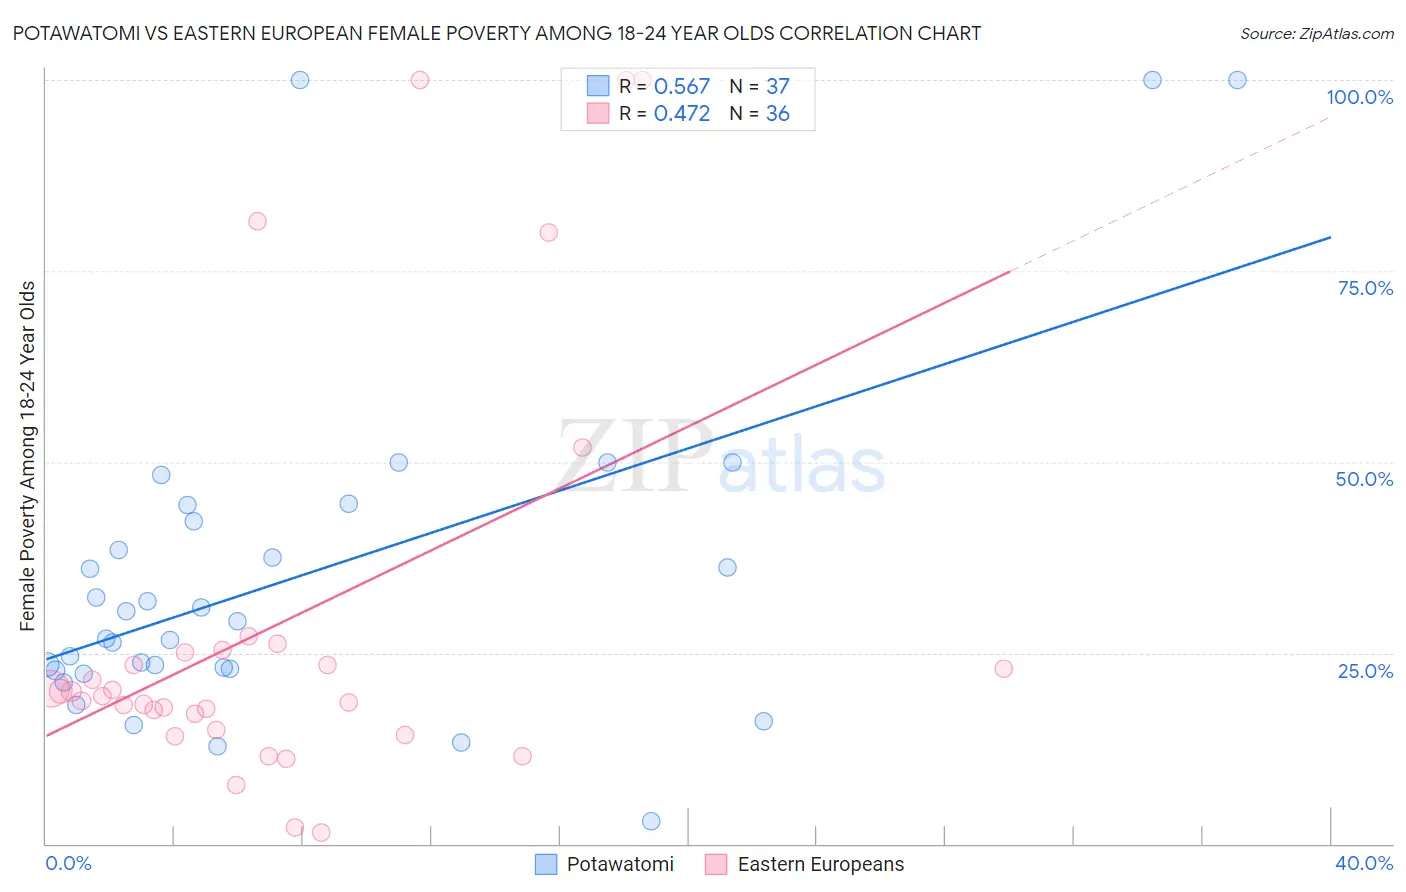
Potawatomi vs Eastern European Female Poverty Among 18-24 Year Olds Correlation Chart
The statistical analysis conducted on geographies consisting of 116,785,145 people shows a substantial positive correlation between the proportion of Potawatomi and poverty level among females between the ages 18 and 24 in the United States with a correlation coefficient (R) of 0.567 and weighted average of 23.7%. Similarly, the statistical analysis conducted on geographies consisting of 442,971,823 people shows a moderate positive correlation between the proportion of Eastern Europeans and poverty level among females between the ages 18 and 24 in the United States with a correlation coefficient (R) of 0.472 and weighted average of 19.9%, a difference of 19.1%.
Female Poverty Among 18-24 Year Olds Correlation Summary
| Measurement | Potawatomi | Eastern European |
| Minimum | 3.0% | 1.6% |
| Maximum | 100.0% | 100.0% |
| Range | 97.0% | 98.4% |
| Mean | 35.1% | 28.9% |
| Median | 29.2% | 19.7% |
| Interquartile 25% (IQ1) | 22.8% | 16.0% |
| Interquartile 75% (IQ3) | 43.3% | 25.3% |
| Interquartile Range (IQR) | 20.5% | 9.3% |
| Standard Deviation (Sample) | 22.6% | 27.3% |
| Standard Deviation (Population) | 22.3% | 26.9% |
Similar Demographics by Female Poverty Among 18-24 Year Olds
Demographics Similar to Potawatomi by Female Poverty Among 18-24 Year Olds
In terms of female poverty among 18-24 year olds, the demographic groups most similar to Potawatomi are Comanche (23.6%, a difference of 0.29%), Blackfeet (23.6%, a difference of 0.34%), Immigrants from Sudan (23.5%, a difference of 0.79%), Cree (23.4%, a difference of 1.1%), and Yuman (24.0%, a difference of 1.2%).
| Demographics | Rating | Rank | Female Poverty Among 18-24 Year Olds |
| Sudanese | 0.0 /100 | #304 | Tragic 23.0% |
| Immigrants | Kuwait | 0.0 /100 | #305 | Tragic 23.0% |
| Paiute | 0.0 /100 | #306 | Tragic 23.3% |
| Cree | 0.0 /100 | #307 | Tragic 23.4% |
| Immigrants | Sudan | 0.0 /100 | #308 | Tragic 23.5% |
| Blackfeet | 0.0 /100 | #309 | Tragic 23.6% |
| Comanche | 0.0 /100 | #310 | Tragic 23.6% |
| Potawatomi | 0.0 /100 | #311 | Tragic 23.7% |
| Yuman | 0.0 /100 | #312 | Tragic 24.0% |
| Creek | 0.0 /100 | #313 | Tragic 24.2% |
| Choctaw | 0.0 /100 | #314 | Tragic 24.3% |
| Blacks/African Americans | 0.0 /100 | #315 | Tragic 24.3% |
| Alsatians | 0.0 /100 | #316 | Tragic 24.4% |
| Osage | 0.0 /100 | #317 | Tragic 24.5% |
| Chickasaw | 0.0 /100 | #318 | Tragic 24.5% |
Demographics Similar to Eastern Europeans by Female Poverty Among 18-24 Year Olds
In terms of female poverty among 18-24 year olds, the demographic groups most similar to Eastern Europeans are Belgian (19.9%, a difference of 0.010%), Central American (19.9%, a difference of 0.040%), Malaysian (19.9%, a difference of 0.21%), French Canadian (19.9%, a difference of 0.23%), and Pakistani (19.8%, a difference of 0.30%).
| Demographics | Rating | Rank | Female Poverty Among 18-24 Year Olds |
| Immigrants | Lebanon | 75.3 /100 | #158 | Good 19.8% |
| Trinidadians and Tobagonians | 74.4 /100 | #159 | Good 19.8% |
| Pakistanis | 74.1 /100 | #160 | Good 19.8% |
| Immigrants | Belize | 74.1 /100 | #161 | Good 19.8% |
| French Canadians | 73.0 /100 | #162 | Good 19.9% |
| Malaysians | 72.7 /100 | #163 | Good 19.9% |
| Central Americans | 70.0 /100 | #164 | Good 19.9% |
| Eastern Europeans | 69.3 /100 | #165 | Good 19.9% |
| Belgians | 69.1 /100 | #166 | Good 19.9% |
| Czechoslovakians | 61.8 /100 | #167 | Good 20.0% |
| Fijians | 59.1 /100 | #168 | Average 20.0% |
| Hmong | 55.4 /100 | #169 | Average 20.0% |
| Iranians | 54.7 /100 | #170 | Average 20.1% |
| Immigrants | Nigeria | 54.3 /100 | #171 | Average 20.1% |
| Belizeans | 52.0 /100 | #172 | Average 20.1% |