Potawatomi vs Eastern European In Labor Force | Age 25-29

COMPARE

Potawatomi
Race
Ancestry
AfghanAfricanAlaska NativeAlaskan AthabascanAlbanianAleutAlsatianAmericanApacheArabArapahoArgentineanArmenianAssyrian/Chaldean/SyriacAustralianAustrianBahamianBangladeshiBarbadianBasqueBelgianBelizeanBermudanBhutaneseBlackfeetBolivianBrazilianBritishBritish West IndianBulgarianBurmeseCajunCambodianCanadianCape VerdeanCarpatho RusynCelticCentral AmericanCentral American IndianCherokeeCheyenneChickasawChileanChineseChippewaChoctawColombianColvilleComancheCosta RicanCreeCreekCroatianCrowCubanCypriotCzechCzechoslovakianDanishDelawareDominicanDutchDutch West IndianEcuadorianEgyptianEnglishEstonianEthiopianEuropeanFijianFilipinoFinnishFrenchFrench American IndianFrench CanadianGermanGerman RussianGhanaianGreekGuamanian/ChamorroGuatemalanGuyaneseHaitianHmongHonduranHopiHoumaHungarianIcelanderIndian (Asian)IndonesianInupiatIranianIraqiIrishIroquoisIsraeliItalianJamaicanJapaneseJordanianKenyanKiowaKoreanLaotianLatvianLebaneseLiberianLithuanianLumbeeLuxembourgerMacedonianMalaysianMalteseMarshalleseMenomineeMexicanMexican American IndianMongolianMoroccanNative HawaiianNavajoNepaleseNew ZealanderNicaraguanNigerianNorthern EuropeanNorwegianOkinawanOsageOttawaPaiutePakistaniPalestinianPanamanianParaguayanPennsylvania GermanPeruvianPimaPolishPortuguesePotawatomiPuebloPuerto RicanPuget Sound SalishRomanianRussianSalvadoranSamoanScandinavianScotch-IrishScottishSeminoleSenegaleseSerbianShoshoneSierra LeoneanSiouxSlavicSlovakSloveneSomaliSouth AfricanSouth AmericanSouth American IndianSoviet UnionSpaniardSpanishSpanish AmericanSpanish American IndianSri LankanSubsaharan AfricanSudaneseSwedishSwissSyrianTaiwaneseThaiTlingit-HaidaTohono O'OdhamTonganTrinidadian and TobagonianTsimshianTurkishU.S. Virgin IslanderUgandanUkrainianUruguayanUteVenezuelanVietnameseWelshWest IndianYakamaYaquiYugoslavianYumanYup'ikZimbabwean
Immigration
NonimmigrantsImmigrantsAfghanistanAfricaAlbaniaArgentinaArmeniaAsiaAustraliaAustriaBahamasBangladeshBarbadosBelarusBelgiumBelizeBoliviaBosnia and HerzegovinaBrazilBulgariaBurma/MyanmarCabo VerdeCambodiaCameroonCanadaCaribbeanCentral AmericaChileChinaColombiaCongoCosta RicaCroatiaCubaCzechoslovakiaDenmarkDominicaDominican RepublicEastern AfricaEastern AsiaEastern EuropeEcuadorEgyptEl SalvadorEnglandEritreaEthiopiaEuropeFijiFranceGermanyGhanaGreeceGrenadaGuatemalaGuyanaHaitiHondurasHong KongHungaryIndiaIndonesiaIranIraqIrelandIsraelItalyJamaicaJapanJordanKazakhstanKenyaKoreaKuwaitLaosLatin AmericaLatviaLebanonLiberiaLithuaniaMalaysiaMexicoMicronesiaMiddle AfricaMoldovaMoroccoNepalNetherlandsNicaraguaNigeriaNorth AmericaNorth MacedoniaNorthern AfricaNorthern EuropeNorwayOceaniaPakistanPanamaPeruPhilippinesPolandPortugalRomaniaRussiaSaudi ArabiaScotlandSenegalSerbiaSierra LeoneSingaporeSomaliaSouth AfricaSouth AmericaSouth Central AsiaSouth Eastern AsiaSouthern EuropeSpainSri LankaSt. Vincent and the GrenadinesSudanSwedenSwitzerlandSyriaTaiwanThailandTrinidad and TobagoTurkeyUgandaUkraineUruguayUzbekistanVenezuelaVietnamWest IndiesWestern AfricaWestern AsiaWestern EuropeYemenZaireZimbabweAzores
Eastern European
Race
Ancestry
AfghanAfricanAlaska NativeAlaskan AthabascanAlbanianAleutAlsatianAmericanApacheArabArapahoArgentineanArmenianAssyrian/Chaldean/SyriacAustralianAustrianBahamianBangladeshiBarbadianBasqueBelgianBelizeanBermudanBhutaneseBlackfeetBolivianBrazilianBritishBritish West IndianBulgarianBurmeseCajunCambodianCanadianCape VerdeanCarpatho RusynCelticCentral AmericanCentral American IndianCherokeeCheyenneChickasawChileanChineseChippewaChoctawColombianColvilleComancheCosta RicanCreeCreekCroatianCrowCubanCypriotCzechCzechoslovakianDanishDelawareDominicanDutchDutch West IndianEastern EuropeanEcuadorianEgyptianEnglishEstonianEthiopianEuropeanFijianFilipinoFinnishFrenchFrench American IndianFrench CanadianGermanGerman RussianGhanaianGreekGuamanian/ChamorroGuatemalanGuyaneseHaitianHmongHonduranHopiHoumaHungarianIcelanderIndian (Asian)IndonesianInupiatIranianIraqiIrishIroquoisIsraeliItalianJamaicanJapaneseJordanianKenyanKiowaKoreanLaotianLatvianLebaneseLiberianLithuanianLumbeeLuxembourgerMacedonianMalaysianMalteseMarshalleseMenomineeMexicanMexican American IndianMongolianMoroccanNative HawaiianNavajoNepaleseNew ZealanderNicaraguanNigerianNorthern EuropeanNorwegianOkinawanOsageOttawaPaiutePakistaniPalestinianPanamanianParaguayanPennsylvania GermanPeruvianPimaPolishPortuguesePuebloPuerto RicanPuget Sound SalishRomanianRussianSalvadoranSamoanScandinavianScotch-IrishScottishSeminoleSenegaleseSerbianShoshoneSierra LeoneanSiouxSlavicSlovakSloveneSomaliSouth AfricanSouth AmericanSouth American IndianSoviet UnionSpaniardSpanishSpanish AmericanSpanish American IndianSri LankanSubsaharan AfricanSudaneseSwedishSwissSyrianTaiwaneseThaiTlingit-HaidaTohono O'OdhamTonganTrinidadian and TobagonianTsimshianTurkishU.S. Virgin IslanderUgandanUkrainianUruguayanUteVenezuelanVietnameseWelshWest IndianYakamaYaquiYugoslavianYumanYup'ikZimbabwean
Immigration
NonimmigrantsImmigrantsAfghanistanAfricaAlbaniaArgentinaArmeniaAsiaAustraliaAustriaBahamasBangladeshBarbadosBelarusBelgiumBelizeBoliviaBosnia and HerzegovinaBrazilBulgariaBurma/MyanmarCabo VerdeCambodiaCameroonCanadaCaribbeanCentral AmericaChileChinaColombiaCongoCosta RicaCroatiaCubaCzechoslovakiaDenmarkDominicaDominican RepublicEastern AfricaEastern AsiaEastern EuropeEcuadorEgyptEl SalvadorEnglandEritreaEthiopiaEuropeFijiFranceGermanyGhanaGreeceGrenadaGuatemalaGuyanaHaitiHondurasHong KongHungaryIndiaIndonesiaIranIraqIrelandIsraelItalyJamaicaJapanJordanKazakhstanKenyaKoreaKuwaitLaosLatin AmericaLatviaLebanonLiberiaLithuaniaMalaysiaMexicoMicronesiaMiddle AfricaMoldovaMoroccoNepalNetherlandsNicaraguaNigeriaNorth AmericaNorth MacedoniaNorthern AfricaNorthern EuropeNorwayOceaniaPakistanPanamaPeruPhilippinesPolandPortugalRomaniaRussiaSaudi ArabiaScotlandSenegalSerbiaSierra LeoneSingaporeSomaliaSouth AfricaSouth AmericaSouth Central AsiaSouth Eastern AsiaSouthern EuropeSpainSri LankaSt. Vincent and the GrenadinesSudanSwedenSwitzerlandSyriaTaiwanThailandTrinidad and TobagoTurkeyUgandaUkraineUruguayUzbekistanVenezuelaVietnamWest IndiesWestern AfricaWestern AsiaWestern EuropeYemenZaireZimbabweAzores
In Labor Force | Age 25-29
Income
Poverty
Unemployment
Labor Participation
Family Structure
Vehicle Availability
Education Level
Disability

In Labor Force | Age 25-29 Comparison

Potawatomi

Eastern Europeans

Tragic
Exceptional
82.9%
IN LABOR FORCE | AGE 25-29
0.0/ 100
METRIC RATING
297th/ 347
METRIC RANK
85.5%
IN LABOR FORCE | AGE 25-29
99.6/ 100
METRIC RATING
56th/ 347
METRIC RANK

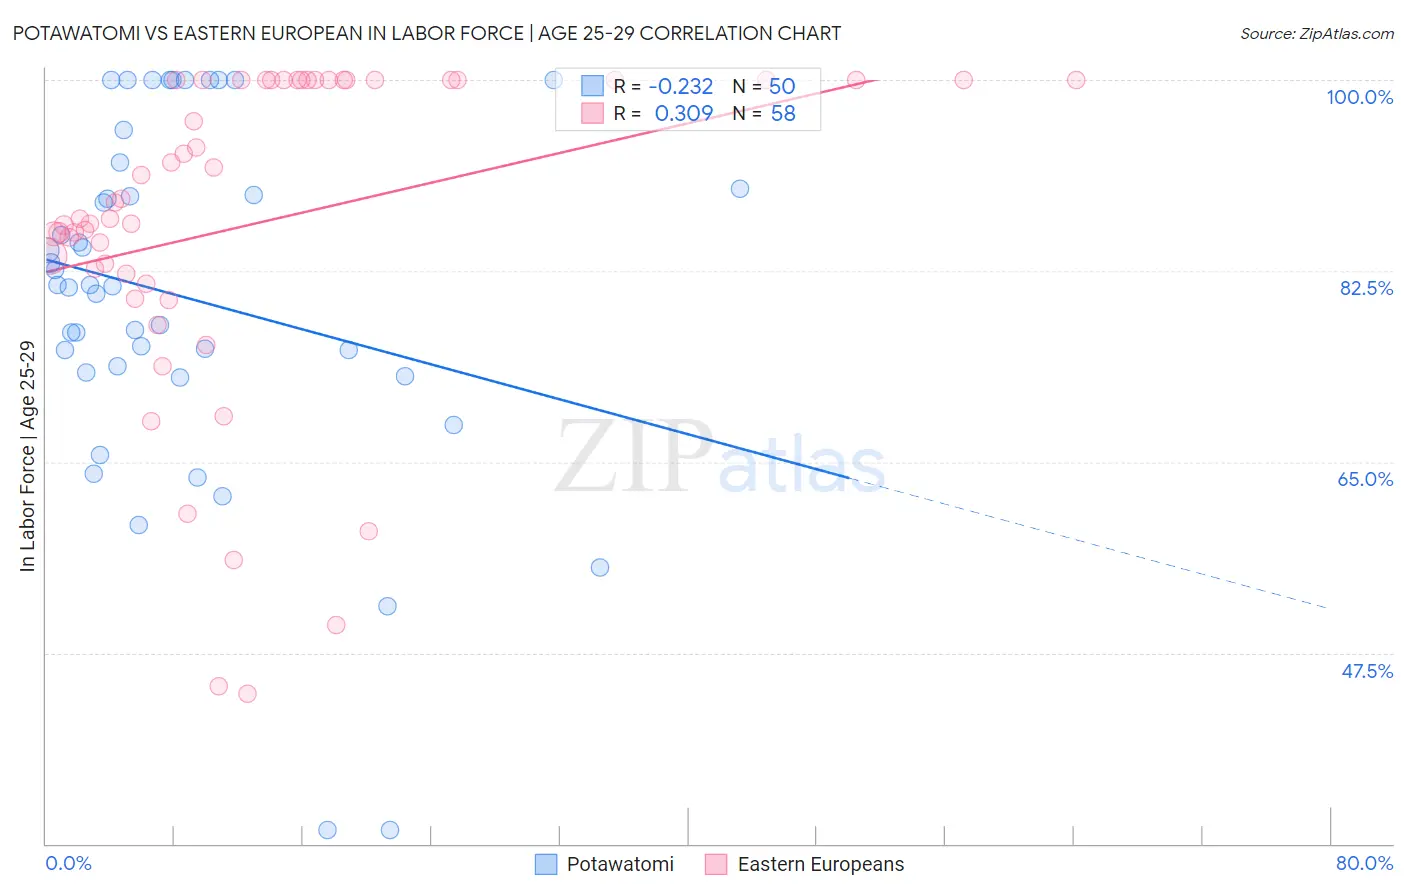
Potawatomi vs Eastern European In Labor Force | Age 25-29 Correlation Chart

The statistical analysis conducted on geographies consisting of 117,757,873 people shows a weak negative correlation between the proportion of Potawatomi and labor force participation rate among population between the ages 25 and 29 in the United States with a correlation coefficient (R) of -0.232 and weighted average of 82.9%. Similarly, the statistical analysis conducted on geographies consisting of 460,900,054 people shows a mild positive correlation between the proportion of Eastern Europeans and labor force participation rate among population between the ages 25 and 29 in the United States with a correlation coefficient (R) of 0.309 and weighted average of 85.5%, a difference of 3.1%.
Potawatomi vs Eastern European In Labor Force | Age 25-29

In Labor Force | Age 25-29 Correlation Summary

MeasurementPotawatomiEastern European
Minimum31.3%43.8%
Maximum100.0%100.0%
Range68.7%56.2%
Mean80.0%86.9%
Median81.1%88.0%
Interquartile 25% (IQ1)73.2%82.2%
Interquartile 75% (IQ3)90.0%100.0%
Interquartile Range (IQR)16.8%17.8%
Standard Deviation (Sample)16.3%14.9%
Standard Deviation (Population)16.1%14.7%

Similar Demographics by In Labor Force | Age 25-29

Demographics Similar to Potawatomi by In Labor Force | Age 25-29

In terms of in labor force | age 25-29, the demographic groups most similar to Potawatomi are Chippewa (82.9%, a difference of 0.0%), Immigrants from Nicaragua (82.9%, a difference of 0.0%), Immigrants from Latin America (82.9%, a difference of 0.010%), Nepalese (82.9%, a difference of 0.010%), and Native Hawaiian (82.9%, a difference of 0.010%).
DemographicsRating | RankIn Labor Force | Age 25-29
Immigrants | Bangladesh
0.0
/100
|
#290
Tragic
83.0%
Hawaiians
0.0
/100
|
#291
Tragic
83.0%
Immigrants | Guyana
0.0
/100
|
#292
Tragic
83.0%
Immigrants | Latin America
0.0
/100
|
#293
Tragic
82.9%
Nepalese
0.0
/100
|
#294
Tragic
82.9%
Chippewa
0.0
/100
|
#295
Tragic
82.9%
Immigrants | Nicaragua
0.0
/100
|
#296
Tragic
82.9%
Potawatomi
0.0
/100
|
#297
Tragic
82.9%
Native Hawaiians
0.0
/100
|
#298
Tragic
82.9%
Fijians
0.0
/100
|
#299
Tragic
82.9%
Spanish American Indians
0.0
/100
|
#300
Tragic
82.9%
Vietnamese
0.0
/100
|
#301
Tragic
82.8%
Immigrants | Belize
0.0
/100
|
#302
Tragic
82.8%
Immigrants | Grenada
0.0
/100
|
#303
Tragic
82.8%
Immigrants | St. Vincent and the Grenadines
0.0
/100
|
#304
Tragic
82.7%

Demographics Similar to Eastern Europeans by In Labor Force | Age 25-29

In terms of in labor force | age 25-29, the demographic groups most similar to Eastern Europeans are Estonian (85.5%, a difference of 0.010%), Greek (85.5%, a difference of 0.010%), Immigrants from Morocco (85.5%, a difference of 0.020%), Immigrants from Brazil (85.5%, a difference of 0.030%), and Belgian (85.5%, a difference of 0.040%).
DemographicsRating | RankIn Labor Force | Age 25-29
Swedes
99.8
/100
|
#49
Exceptional
85.6%
Yugoslavians
99.8
/100
|
#50
Exceptional
85.6%
Immigrants | Latvia
99.8
/100
|
#51
Exceptional
85.6%
Immigrants | Poland
99.7
/100
|
#52
Exceptional
85.6%
Belgians
99.7
/100
|
#53
Exceptional
85.5%
Albanians
99.7
/100
|
#54
Exceptional
85.5%
Immigrants | Brazil
99.7
/100
|
#55
Exceptional
85.5%
Eastern Europeans
99.6
/100
|
#56
Exceptional
85.5%
Estonians
99.6
/100
|
#57
Exceptional
85.5%
Greeks
99.6
/100
|
#58
Exceptional
85.5%
Immigrants | Morocco
99.5
/100
|
#59
Exceptional
85.5%
Thais
99.5
/100
|
#60
Exceptional
85.5%
Serbians
99.5
/100
|
#61
Exceptional
85.5%
Taiwanese
99.4
/100
|
#62
Exceptional
85.4%
Immigrants | Kenya
99.4
/100
|
#63
Exceptional
85.4%