Immigrants from Egypt vs Eastern European Female Poverty Among 18-24 Year Olds
COMPARE
Immigrants from Egypt
Eastern European
Female Poverty Among 18-24 Year Olds
Female Poverty Among 18-24 Year Olds Comparison
Immigrants from Egypt
Eastern Europeans
18.4%
FEMALE POVERTY AMONG 18-24 YEAR OLDS
99.9/ 100
METRIC RATING
54th/ 347
METRIC RANK
19.9%
FEMALE POVERTY AMONG 18-24 YEAR OLDS
69.3/ 100
METRIC RATING
165th/ 347
METRIC RANK
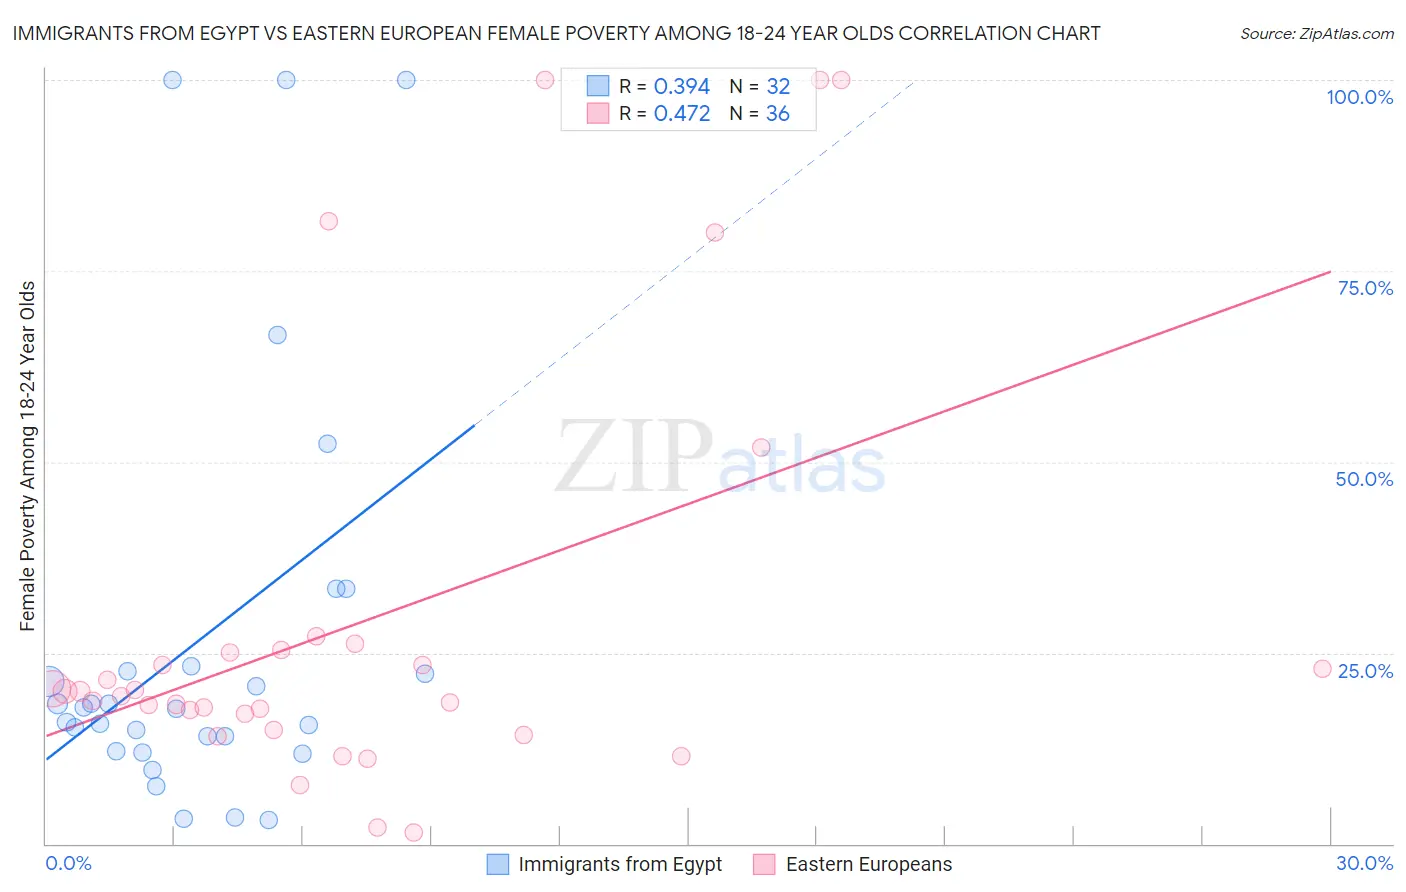
Immigrants from Egypt vs Eastern European Female Poverty Among 18-24 Year Olds Correlation Chart
The statistical analysis conducted on geographies consisting of 241,711,219 people shows a mild positive correlation between the proportion of Immigrants from Egypt and poverty level among females between the ages 18 and 24 in the United States with a correlation coefficient (R) of 0.394 and weighted average of 18.4%. Similarly, the statistical analysis conducted on geographies consisting of 442,971,823 people shows a moderate positive correlation between the proportion of Eastern Europeans and poverty level among females between the ages 18 and 24 in the United States with a correlation coefficient (R) of 0.472 and weighted average of 19.9%, a difference of 8.4%.
Female Poverty Among 18-24 Year Olds Correlation Summary
| Measurement | Immigrants from Egypt | Eastern European |
| Minimum | 3.1% | 1.6% |
| Maximum | 100.0% | 100.0% |
| Range | 96.9% | 98.4% |
| Mean | 26.7% | 28.9% |
| Median | 17.8% | 19.7% |
| Interquartile 25% (IQ1) | 13.1% | 16.0% |
| Interquartile 75% (IQ3) | 22.9% | 25.3% |
| Interquartile Range (IQR) | 9.9% | 9.3% |
| Standard Deviation (Sample) | 27.2% | 27.3% |
| Standard Deviation (Population) | 26.7% | 26.9% |
Similar Demographics by Female Poverty Among 18-24 Year Olds
Demographics Similar to Immigrants from Egypt by Female Poverty Among 18-24 Year Olds
In terms of female poverty among 18-24 year olds, the demographic groups most similar to Immigrants from Egypt are Albanian (18.4%, a difference of 0.010%), Argentinean (18.4%, a difference of 0.020%), Immigrants from Italy (18.4%, a difference of 0.13%), Immigrants from Ukraine (18.4%, a difference of 0.19%), and Italian (18.3%, a difference of 0.22%).
| Demographics | Rating | Rank | Female Poverty Among 18-24 Year Olds |
| Asians | 100.0 /100 | #47 | Exceptional 18.2% |
| Sri Lankans | 100.0 /100 | #48 | Exceptional 18.2% |
| Bhutanese | 100.0 /100 | #49 | Exceptional 18.2% |
| Samoans | 100.0 /100 | #50 | Exceptional 18.2% |
| Immigrants | Eastern Europe | 99.9 /100 | #51 | Exceptional 18.2% |
| Immigrants | Ireland | 99.9 /100 | #52 | Exceptional 18.3% |
| Italians | 99.9 /100 | #53 | Exceptional 18.3% |
| Immigrants | Egypt | 99.9 /100 | #54 | Exceptional 18.4% |
| Albanians | 99.9 /100 | #55 | Exceptional 18.4% |
| Argentineans | 99.9 /100 | #56 | Exceptional 18.4% |
| Immigrants | Italy | 99.9 /100 | #57 | Exceptional 18.4% |
| Immigrants | Ukraine | 99.9 /100 | #58 | Exceptional 18.4% |
| Egyptians | 99.9 /100 | #59 | Exceptional 18.5% |
| Immigrants | Brazil | 99.8 /100 | #60 | Exceptional 18.5% |
| Immigrants | Albania | 99.8 /100 | #61 | Exceptional 18.5% |
Demographics Similar to Eastern Europeans by Female Poverty Among 18-24 Year Olds
In terms of female poverty among 18-24 year olds, the demographic groups most similar to Eastern Europeans are Belgian (19.9%, a difference of 0.010%), Central American (19.9%, a difference of 0.040%), Malaysian (19.9%, a difference of 0.21%), French Canadian (19.9%, a difference of 0.23%), and Pakistani (19.8%, a difference of 0.30%).
| Demographics | Rating | Rank | Female Poverty Among 18-24 Year Olds |
| Immigrants | Lebanon | 75.3 /100 | #158 | Good 19.8% |
| Trinidadians and Tobagonians | 74.4 /100 | #159 | Good 19.8% |
| Pakistanis | 74.1 /100 | #160 | Good 19.8% |
| Immigrants | Belize | 74.1 /100 | #161 | Good 19.8% |
| French Canadians | 73.0 /100 | #162 | Good 19.9% |
| Malaysians | 72.7 /100 | #163 | Good 19.9% |
| Central Americans | 70.0 /100 | #164 | Good 19.9% |
| Eastern Europeans | 69.3 /100 | #165 | Good 19.9% |
| Belgians | 69.1 /100 | #166 | Good 19.9% |
| Czechoslovakians | 61.8 /100 | #167 | Good 20.0% |
| Fijians | 59.1 /100 | #168 | Average 20.0% |
| Hmong | 55.4 /100 | #169 | Average 20.0% |
| Iranians | 54.7 /100 | #170 | Average 20.1% |
| Immigrants | Nigeria | 54.3 /100 | #171 | Average 20.1% |
| Belizeans | 52.0 /100 | #172 | Average 20.1% |