Portuguese vs Immigrants from Israel Single Mother Poverty
COMPARE
Portuguese
Immigrants from Israel
Single Mother Poverty
Single Mother Poverty Comparison
Portuguese
Immigrants from Israel
28.8%
SINGLE MOTHER POVERTY
73.2/ 100
METRIC RATING
154th/ 347
METRIC RANK
26.6%
SINGLE MOTHER POVERTY
99.9/ 100
METRIC RATING
37th/ 347
METRIC RANK
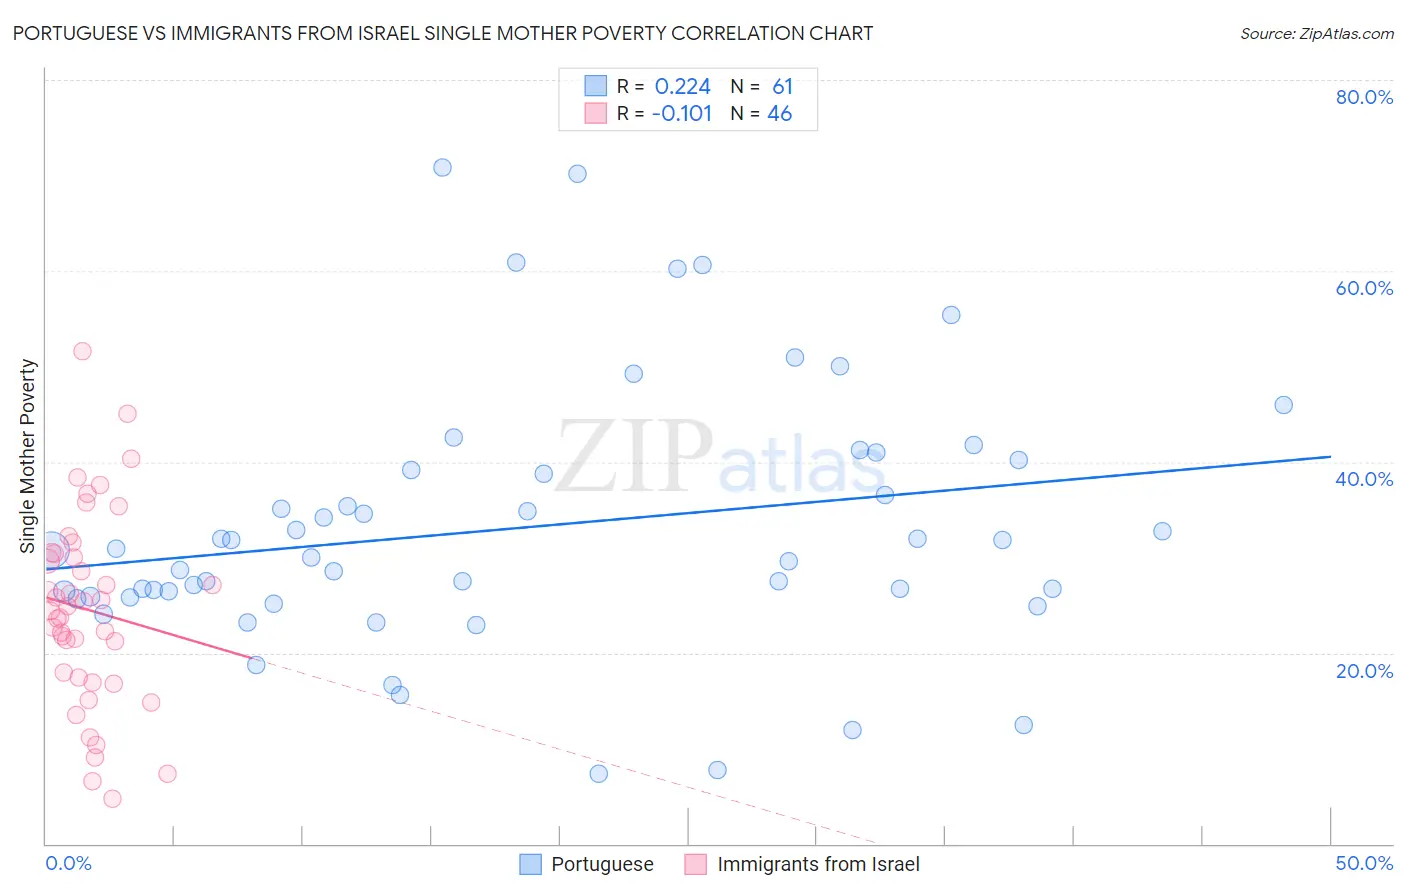
Portuguese vs Immigrants from Israel Single Mother Poverty Correlation Chart
The statistical analysis conducted on geographies consisting of 435,396,736 people shows a weak positive correlation between the proportion of Portuguese and poverty level among single mothers in the United States with a correlation coefficient (R) of 0.224 and weighted average of 28.8%. Similarly, the statistical analysis conducted on geographies consisting of 206,012,343 people shows a poor negative correlation between the proportion of Immigrants from Israel and poverty level among single mothers in the United States with a correlation coefficient (R) of -0.101 and weighted average of 26.6%, a difference of 8.3%.
Single Mother Poverty Correlation Summary
| Measurement | Portuguese | Immigrants from Israel |
| Minimum | 7.4% | 4.7% |
| Maximum | 70.8% | 51.6% |
| Range | 63.4% | 46.9% |
| Mean | 33.1% | 24.5% |
| Median | 30.8% | 24.6% |
| Interquartile 25% (IQ1) | 25.9% | 17.4% |
| Interquartile 75% (IQ3) | 39.7% | 30.4% |
| Interquartile Range (IQR) | 13.8% | 13.0% |
| Standard Deviation (Sample) | 13.6% | 10.2% |
| Standard Deviation (Population) | 13.5% | 10.0% |
Similar Demographics by Single Mother Poverty
Demographics Similar to Portuguese by Single Mother Poverty
In terms of single mother poverty, the demographic groups most similar to Portuguese are Ugandan (28.8%, a difference of 0.090%), Iraqi (28.8%, a difference of 0.10%), Immigrants from Western Europe (28.9%, a difference of 0.13%), Immigrants from Hungary (28.9%, a difference of 0.16%), and Slovene (28.8%, a difference of 0.21%).
| Demographics | Rating | Rank | Single Mother Poverty |
| Immigrants | Lebanon | 85.3 /100 | #147 | Excellent 28.6% |
| Syrians | 85.3 /100 | #148 | Excellent 28.6% |
| Serbians | 85.0 /100 | #149 | Excellent 28.6% |
| Northern Europeans | 81.7 /100 | #150 | Excellent 28.6% |
| Immigrants | Oceania | 79.9 /100 | #151 | Good 28.7% |
| Austrians | 79.0 /100 | #152 | Good 28.7% |
| Slovenes | 76.4 /100 | #153 | Good 28.8% |
| Portuguese | 73.2 /100 | #154 | Good 28.8% |
| Ugandans | 71.7 /100 | #155 | Good 28.8% |
| Iraqis | 71.5 /100 | #156 | Good 28.8% |
| Immigrants | Western Europe | 71.1 /100 | #157 | Good 28.9% |
| Immigrants | Hungary | 70.6 /100 | #158 | Good 28.9% |
| Czechs | 68.4 /100 | #159 | Good 28.9% |
| Japanese | 68.0 /100 | #160 | Good 28.9% |
| Immigrants | Cambodia | 66.6 /100 | #161 | Good 28.9% |
Demographics Similar to Immigrants from Israel by Single Mother Poverty
In terms of single mother poverty, the demographic groups most similar to Immigrants from Israel are Okinawan (26.6%, a difference of 0.0%), Immigrants from Fiji (26.6%, a difference of 0.040%), Maltese (26.6%, a difference of 0.050%), Immigrants from Indonesia (26.6%, a difference of 0.17%), and Bulgarian (26.5%, a difference of 0.18%).
| Demographics | Rating | Rank | Single Mother Poverty |
| Turks | 100.0 /100 | #30 | Exceptional 26.4% |
| Immigrants | Philippines | 100.0 /100 | #31 | Exceptional 26.5% |
| Tongans | 99.9 /100 | #32 | Exceptional 26.5% |
| Bulgarians | 99.9 /100 | #33 | Exceptional 26.5% |
| Immigrants | Indonesia | 99.9 /100 | #34 | Exceptional 26.6% |
| Maltese | 99.9 /100 | #35 | Exceptional 26.6% |
| Okinawans | 99.9 /100 | #36 | Exceptional 26.6% |
| Immigrants | Israel | 99.9 /100 | #37 | Exceptional 26.6% |
| Immigrants | Fiji | 99.9 /100 | #38 | Exceptional 26.6% |
| Sri Lankans | 99.9 /100 | #39 | Exceptional 26.7% |
| Immigrants | Vietnam | 99.9 /100 | #40 | Exceptional 26.7% |
| Immigrants | Greece | 99.9 /100 | #41 | Exceptional 26.7% |
| Armenians | 99.9 /100 | #42 | Exceptional 26.8% |
| Tsimshian | 99.9 /100 | #43 | Exceptional 26.8% |
| Immigrants | Sierra Leone | 99.9 /100 | #44 | Exceptional 26.9% |