Immigrants from Senegal vs Immigrants from Grenada Family Poverty
COMPARE
Immigrants from Senegal
Immigrants from Grenada
Family Poverty
Family Poverty Comparison
Immigrants from Senegal
Immigrants from Grenada
11.7%
FAMILY POVERTY
0.0/ 100
METRIC RATING
298th/ 347
METRIC RANK
12.4%
FAMILY POVERTY
0.0/ 100
METRIC RATING
317th/ 347
METRIC RANK
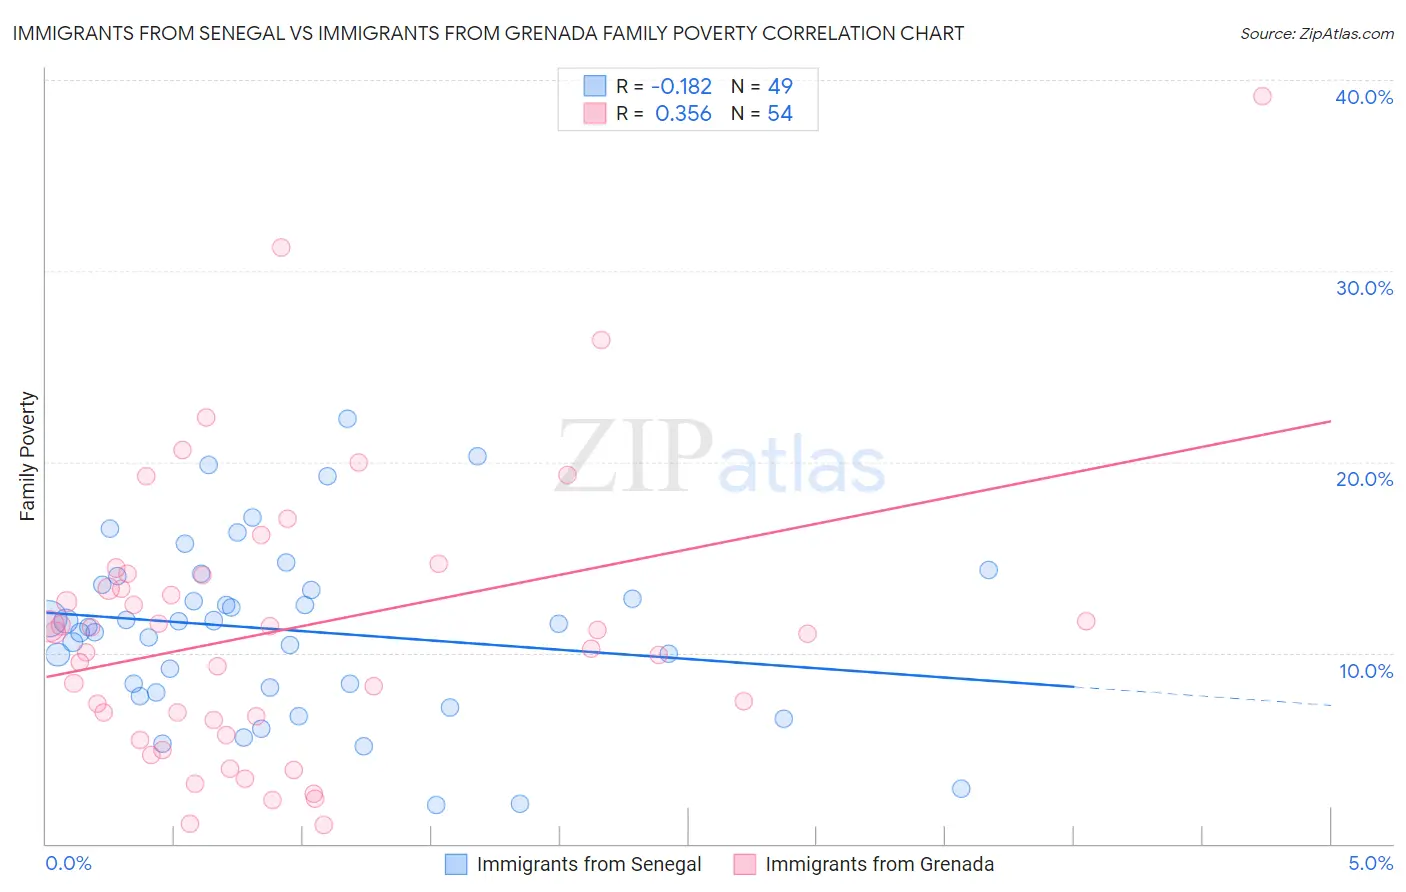
Immigrants from Senegal vs Immigrants from Grenada Family Poverty Correlation Chart
The statistical analysis conducted on geographies consisting of 90,075,938 people shows a poor negative correlation between the proportion of Immigrants from Senegal and poverty level among families in the United States with a correlation coefficient (R) of -0.182 and weighted average of 11.7%. Similarly, the statistical analysis conducted on geographies consisting of 67,148,285 people shows a mild positive correlation between the proportion of Immigrants from Grenada and poverty level among families in the United States with a correlation coefficient (R) of 0.356 and weighted average of 12.4%, a difference of 6.2%.
Family Poverty Correlation Summary
| Measurement | Immigrants from Senegal | Immigrants from Grenada |
| Minimum | 2.0% | 0.96% |
| Maximum | 22.3% | 39.2% |
| Range | 20.2% | 38.2% |
| Mean | 11.2% | 11.3% |
| Median | 11.5% | 11.0% |
| Interquartile 25% (IQ1) | 8.1% | 6.5% |
| Interquartile 75% (IQ3) | 13.8% | 14.1% |
| Interquartile Range (IQR) | 5.7% | 7.6% |
| Standard Deviation (Sample) | 4.6% | 7.4% |
| Standard Deviation (Population) | 4.5% | 7.3% |
Demographics Similar to Immigrants from Senegal and Immigrants from Grenada by Family Poverty
In terms of family poverty, the demographic groups most similar to Immigrants from Senegal are Dutch West Indian (11.7%, a difference of 0.10%), Immigrants from Bangladesh (11.7%, a difference of 0.11%), Creek (11.7%, a difference of 0.14%), Bahamian (11.7%, a difference of 0.36%), and Guatemalan (11.7%, a difference of 0.41%). Similarly, the demographic groups most similar to Immigrants from Grenada are Honduran (12.4%, a difference of 0.22%), Immigrants from Mexico (12.3%, a difference of 0.96%), Kiowa (12.2%, a difference of 1.2%), Immigrants from Caribbean (12.2%, a difference of 1.7%), and Immigrants from Central America (12.1%, a difference of 2.4%).
| Demographics | Rating | Rank | Family Poverty |
| Creek | 0.0 /100 | #297 | Tragic 11.7% |
| Immigrants | Senegal | 0.0 /100 | #298 | Tragic 11.7% |
| Dutch West Indians | 0.0 /100 | #299 | Tragic 11.7% |
| Immigrants | Bangladesh | 0.0 /100 | #300 | Tragic 11.7% |
| Bahamians | 0.0 /100 | #301 | Tragic 11.7% |
| Guatemalans | 0.0 /100 | #302 | Tragic 11.7% |
| Africans | 0.0 /100 | #303 | Tragic 11.8% |
| Immigrants | Latin America | 0.0 /100 | #304 | Tragic 11.8% |
| Mexicans | 0.0 /100 | #305 | Tragic 11.8% |
| Cajuns | 0.0 /100 | #306 | Tragic 11.9% |
| Immigrants | Congo | 0.0 /100 | #307 | Tragic 11.9% |
| Seminole | 0.0 /100 | #308 | Tragic 11.9% |
| Hispanics or Latinos | 0.0 /100 | #309 | Tragic 12.0% |
| Immigrants | Guatemala | 0.0 /100 | #310 | Tragic 12.0% |
| Ute | 0.0 /100 | #311 | Tragic 12.1% |
| Immigrants | Central America | 0.0 /100 | #312 | Tragic 12.1% |
| Immigrants | Caribbean | 0.0 /100 | #313 | Tragic 12.2% |
| Kiowa | 0.0 /100 | #314 | Tragic 12.2% |
| Immigrants | Mexico | 0.0 /100 | #315 | Tragic 12.3% |
| Hondurans | 0.0 /100 | #316 | Tragic 12.4% |
| Immigrants | Grenada | 0.0 /100 | #317 | Tragic 12.4% |