Immigrants from Cuba vs Estonian Single Father Poverty
COMPARE
Immigrants from Cuba
Estonian
Single Father Poverty
Single Father Poverty Comparison
Immigrants from Cuba
Estonians
16.4%
SINGLE FATHER POVERTY
41.6/ 100
METRIC RATING
178th/ 347
METRIC RANK
16.2%
SINGLE FATHER POVERTY
56.7/ 100
METRIC RATING
161st/ 347
METRIC RANK
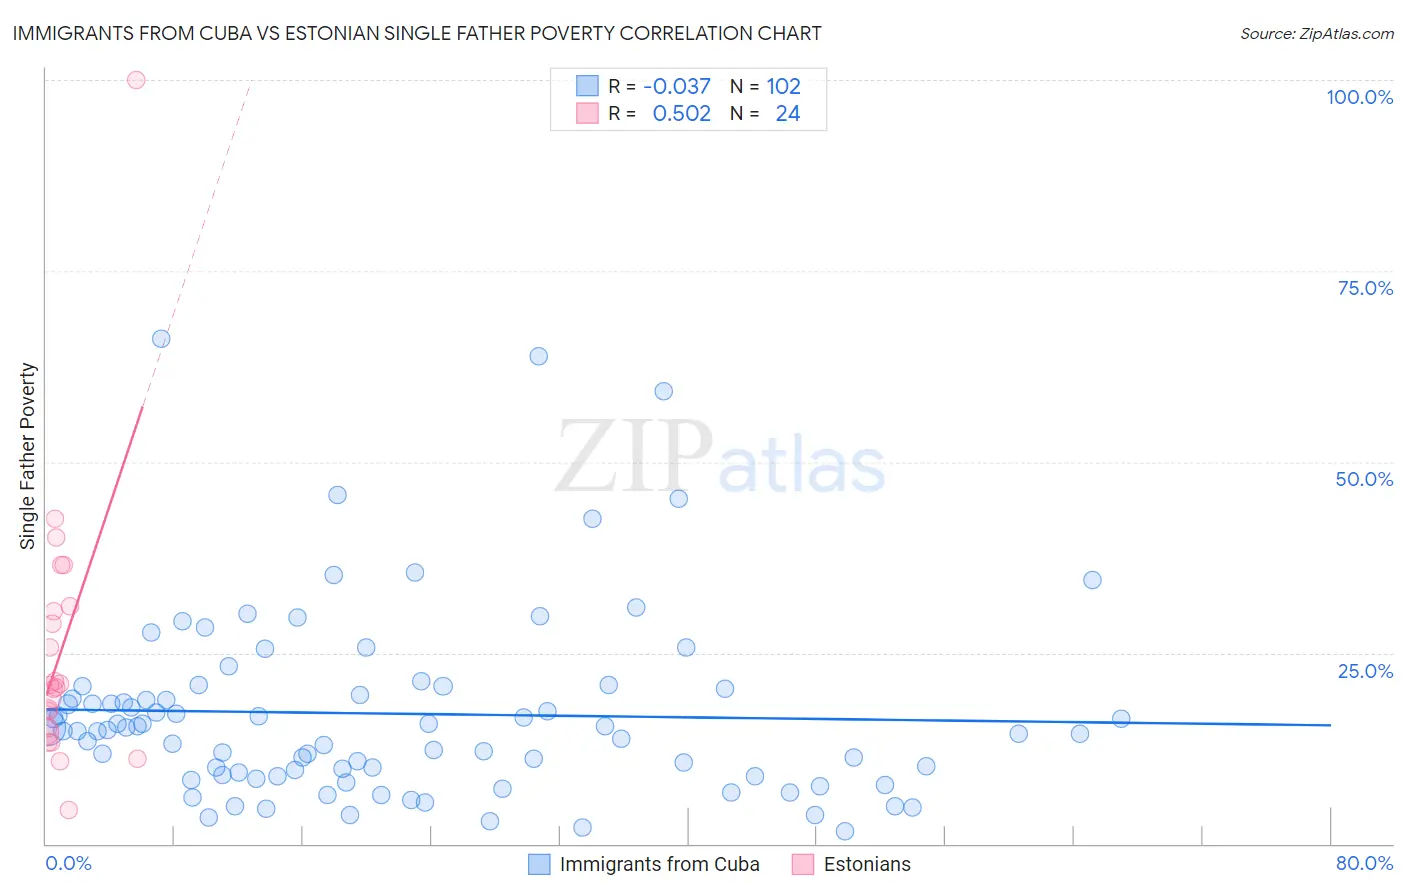
Immigrants from Cuba vs Estonian Single Father Poverty Correlation Chart
The statistical analysis conducted on geographies consisting of 265,819,511 people shows no correlation between the proportion of Immigrants from Cuba and poverty level among single fathers in the United States with a correlation coefficient (R) of -0.037 and weighted average of 16.4%. Similarly, the statistical analysis conducted on geographies consisting of 107,284,896 people shows a substantial positive correlation between the proportion of Estonians and poverty level among single fathers in the United States with a correlation coefficient (R) of 0.502 and weighted average of 16.2%, a difference of 0.67%.
Single Father Poverty Correlation Summary
| Measurement | Immigrants from Cuba | Estonian |
| Minimum | 1.6% | 4.3% |
| Maximum | 66.1% | 100.0% |
| Range | 64.5% | 95.7% |
| Mean | 17.0% | 25.5% |
| Median | 14.9% | 20.6% |
| Interquartile 25% (IQ1) | 9.0% | 14.9% |
| Interquartile 75% (IQ3) | 20.3% | 30.7% |
| Interquartile Range (IQR) | 11.3% | 15.8% |
| Standard Deviation (Sample) | 12.2% | 18.7% |
| Standard Deviation (Population) | 12.2% | 18.3% |
Demographics Similar to Immigrants from Cuba and Estonians by Single Father Poverty
In terms of single father poverty, the demographic groups most similar to Immigrants from Cuba are Serbian (16.4%, a difference of 0.030%), Immigrants from South Africa (16.3%, a difference of 0.12%), Vietnamese (16.3%, a difference of 0.29%), Immigrants from Ecuador (16.3%, a difference of 0.36%), and Swedish (16.3%, a difference of 0.37%). Similarly, the demographic groups most similar to Estonians are Ugandan (16.3%, a difference of 0.040%), Immigrants from Costa Rica (16.3%, a difference of 0.040%), Guyanese (16.3%, a difference of 0.070%), Immigrants from Bangladesh (16.3%, a difference of 0.070%), and Immigrants from Europe (16.3%, a difference of 0.080%).
| Demographics | Rating | Rank | Single Father Poverty |
| Belizeans | 59.9 /100 | #159 | Average 16.2% |
| Immigrants | Sudan | 59.8 /100 | #160 | Average 16.2% |
| Estonians | 56.7 /100 | #161 | Average 16.2% |
| Ugandans | 55.9 /100 | #162 | Average 16.3% |
| Immigrants | Costa Rica | 55.7 /100 | #163 | Average 16.3% |
| Guyanese | 55.2 /100 | #164 | Average 16.3% |
| Immigrants | Bangladesh | 55.1 /100 | #165 | Average 16.3% |
| Immigrants | Europe | 54.8 /100 | #166 | Average 16.3% |
| Yugoslavians | 53.9 /100 | #167 | Average 16.3% |
| Costa Ricans | 53.6 /100 | #168 | Average 16.3% |
| Northern Europeans | 52.8 /100 | #169 | Average 16.3% |
| Scandinavians | 52.3 /100 | #170 | Average 16.3% |
| Immigrants | Morocco | 50.7 /100 | #171 | Average 16.3% |
| Immigrants | Sierra Leone | 50.1 /100 | #172 | Average 16.3% |
| Immigrants | St. Vincent and the Grenadines | 50.0 /100 | #173 | Average 16.3% |
| Swedes | 50.0 /100 | #174 | Average 16.3% |
| Immigrants | Ecuador | 49.7 /100 | #175 | Average 16.3% |
| Vietnamese | 48.0 /100 | #176 | Average 16.3% |
| Immigrants | South Africa | 44.2 /100 | #177 | Average 16.3% |
| Immigrants | Cuba | 41.6 /100 | #178 | Average 16.4% |
| Serbians | 40.9 /100 | #179 | Average 16.4% |