Palestinian vs Italian Child Poverty Among Boys Under 16
COMPARE
Palestinian
Italian
Child Poverty Among Boys Under 16
Child Poverty Among Boys Under 16 Comparison
Palestinians
Italians
15.4%
CHILD POVERTY AMONG BOYS UNDER 16
91.3/ 100
METRIC RATING
126th/ 347
METRIC RANK
14.2%
CHILD POVERTY AMONG BOYS UNDER 16
99.2/ 100
METRIC RATING
50th/ 347
METRIC RANK
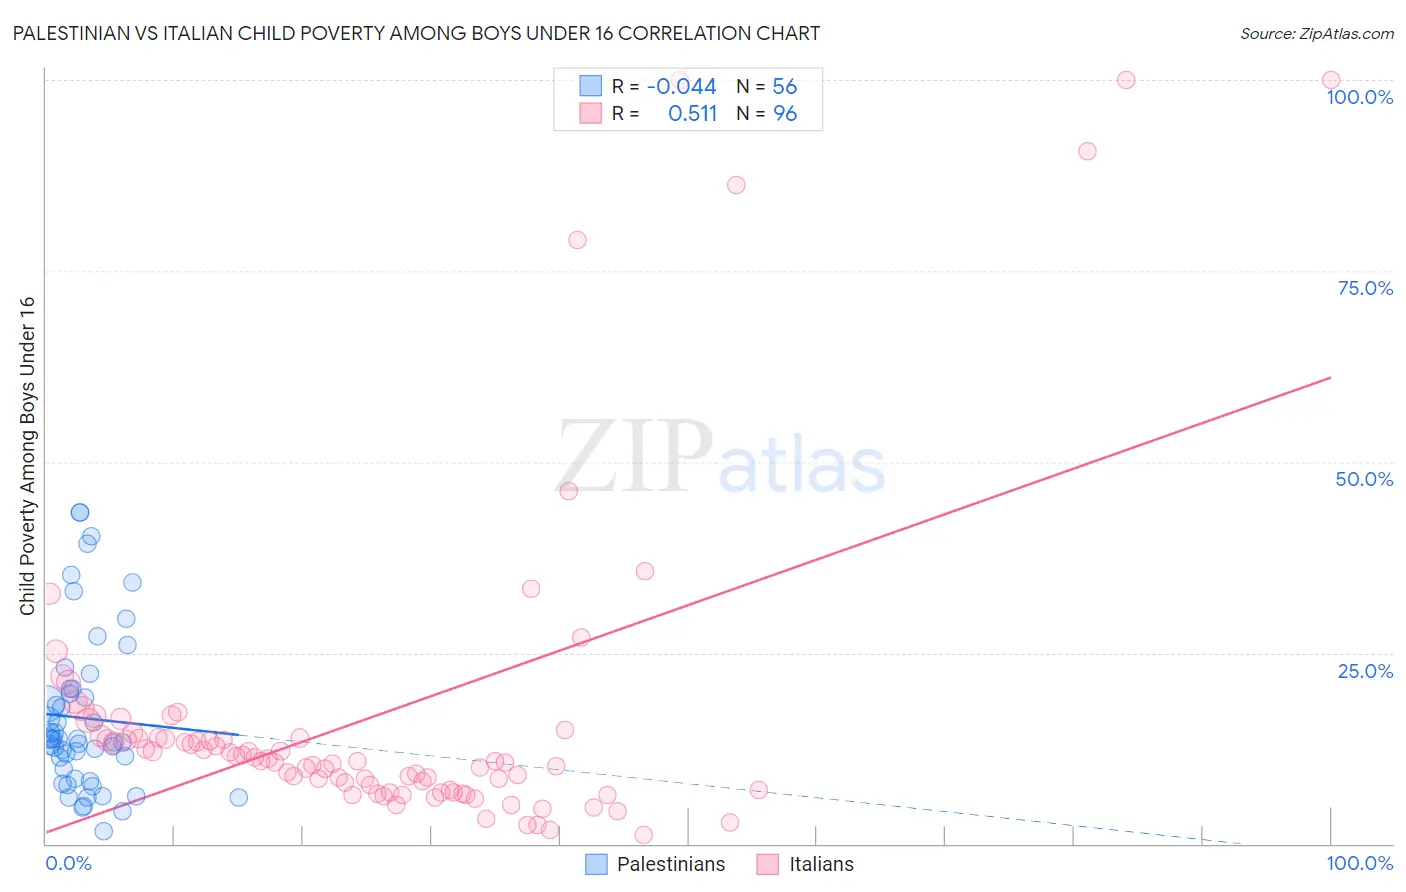
Palestinian vs Italian Child Poverty Among Boys Under 16 Correlation Chart
The statistical analysis conducted on geographies consisting of 214,667,455 people shows no correlation between the proportion of Palestinians and poverty level among boys under the age of 16 in the United States with a correlation coefficient (R) of -0.044 and weighted average of 15.4%. Similarly, the statistical analysis conducted on geographies consisting of 553,398,049 people shows a substantial positive correlation between the proportion of Italians and poverty level among boys under the age of 16 in the United States with a correlation coefficient (R) of 0.511 and weighted average of 14.2%, a difference of 8.1%.
Child Poverty Among Boys Under 16 Correlation Summary
| Measurement | Palestinian | Italian |
| Minimum | 1.7% | 1.1% |
| Maximum | 43.3% | 100.0% |
| Range | 41.7% | 98.9% |
| Mean | 16.4% | 16.8% |
| Median | 13.7% | 10.8% |
| Interquartile 25% (IQ1) | 9.2% | 7.1% |
| Interquartile 75% (IQ3) | 19.9% | 14.0% |
| Interquartile Range (IQR) | 10.7% | 6.9% |
| Standard Deviation (Sample) | 10.3% | 21.1% |
| Standard Deviation (Population) | 10.2% | 20.9% |
Similar Demographics by Child Poverty Among Boys Under 16
Demographics Similar to Palestinians by Child Poverty Among Boys Under 16
In terms of child poverty among boys under 16, the demographic groups most similar to Palestinians are Carpatho Rusyn (15.4%, a difference of 0.050%), Canadian (15.4%, a difference of 0.24%), Czechoslovakian (15.3%, a difference of 0.31%), Immigrants from Brazil (15.4%, a difference of 0.35%), and Mongolian (15.4%, a difference of 0.38%).
| Demographics | Rating | Rank | Child Poverty Among Boys Under 16 |
| Belgians | 93.1 /100 | #119 | Exceptional 15.2% |
| South Africans | 93.0 /100 | #120 | Exceptional 15.2% |
| Scottish | 93.0 /100 | #121 | Exceptional 15.2% |
| Immigrants | Malaysia | 92.8 /100 | #122 | Exceptional 15.3% |
| Immigrants | Norway | 92.3 /100 | #123 | Exceptional 15.3% |
| Tlingit-Haida | 92.2 /100 | #124 | Exceptional 15.3% |
| Czechoslovakians | 92.1 /100 | #125 | Exceptional 15.3% |
| Palestinians | 91.3 /100 | #126 | Exceptional 15.4% |
| Carpatho Rusyns | 91.1 /100 | #127 | Exceptional 15.4% |
| Canadians | 90.6 /100 | #128 | Exceptional 15.4% |
| Immigrants | Brazil | 90.3 /100 | #129 | Exceptional 15.4% |
| Mongolians | 90.2 /100 | #130 | Exceptional 15.4% |
| Immigrants | Western Europe | 90.0 /100 | #131 | Exceptional 15.4% |
| Immigrants | Kazakhstan | 88.7 /100 | #132 | Excellent 15.5% |
| Welsh | 88.3 /100 | #133 | Excellent 15.5% |
Demographics Similar to Italians by Child Poverty Among Boys Under 16
In terms of child poverty among boys under 16, the demographic groups most similar to Italians are Immigrants from Greece (14.2%, a difference of 0.13%), Czech (14.1%, a difference of 0.49%), Immigrants from Indonesia (14.1%, a difference of 0.57%), Immigrants from Moldova (14.1%, a difference of 0.59%), and Laotian (14.3%, a difference of 0.82%).
| Demographics | Rating | Rank | Child Poverty Among Boys Under 16 |
| Croatians | 99.5 /100 | #43 | Exceptional 14.0% |
| Estonians | 99.4 /100 | #44 | Exceptional 14.1% |
| Immigrants | Scotland | 99.4 /100 | #45 | Exceptional 14.1% |
| Greeks | 99.4 /100 | #46 | Exceptional 14.1% |
| Immigrants | Moldova | 99.4 /100 | #47 | Exceptional 14.1% |
| Immigrants | Indonesia | 99.4 /100 | #48 | Exceptional 14.1% |
| Czechs | 99.3 /100 | #49 | Exceptional 14.1% |
| Italians | 99.2 /100 | #50 | Exceptional 14.2% |
| Immigrants | Greece | 99.2 /100 | #51 | Exceptional 14.2% |
| Laotians | 99.0 /100 | #52 | Exceptional 14.3% |
| Immigrants | Philippines | 99.0 /100 | #53 | Exceptional 14.3% |
| Immigrants | Serbia | 99.0 /100 | #54 | Exceptional 14.3% |
| Immigrants | Pakistan | 99.0 /100 | #55 | Exceptional 14.3% |
| Zimbabweans | 99.0 /100 | #56 | Exceptional 14.3% |
| Poles | 98.9 /100 | #57 | Exceptional 14.4% |