Palestinian vs Nepalese Child Poverty Among Boys Under 16
COMPARE
Palestinian
Nepalese
Child Poverty Among Boys Under 16
Child Poverty Among Boys Under 16 Comparison
Palestinians
Nepalese
15.4%
CHILD POVERTY AMONG BOYS UNDER 16
91.3/ 100
METRIC RATING
126th/ 347
METRIC RANK
18.0%
CHILD POVERTY AMONG BOYS UNDER 16
3.2/ 100
METRIC RATING
224th/ 347
METRIC RANK
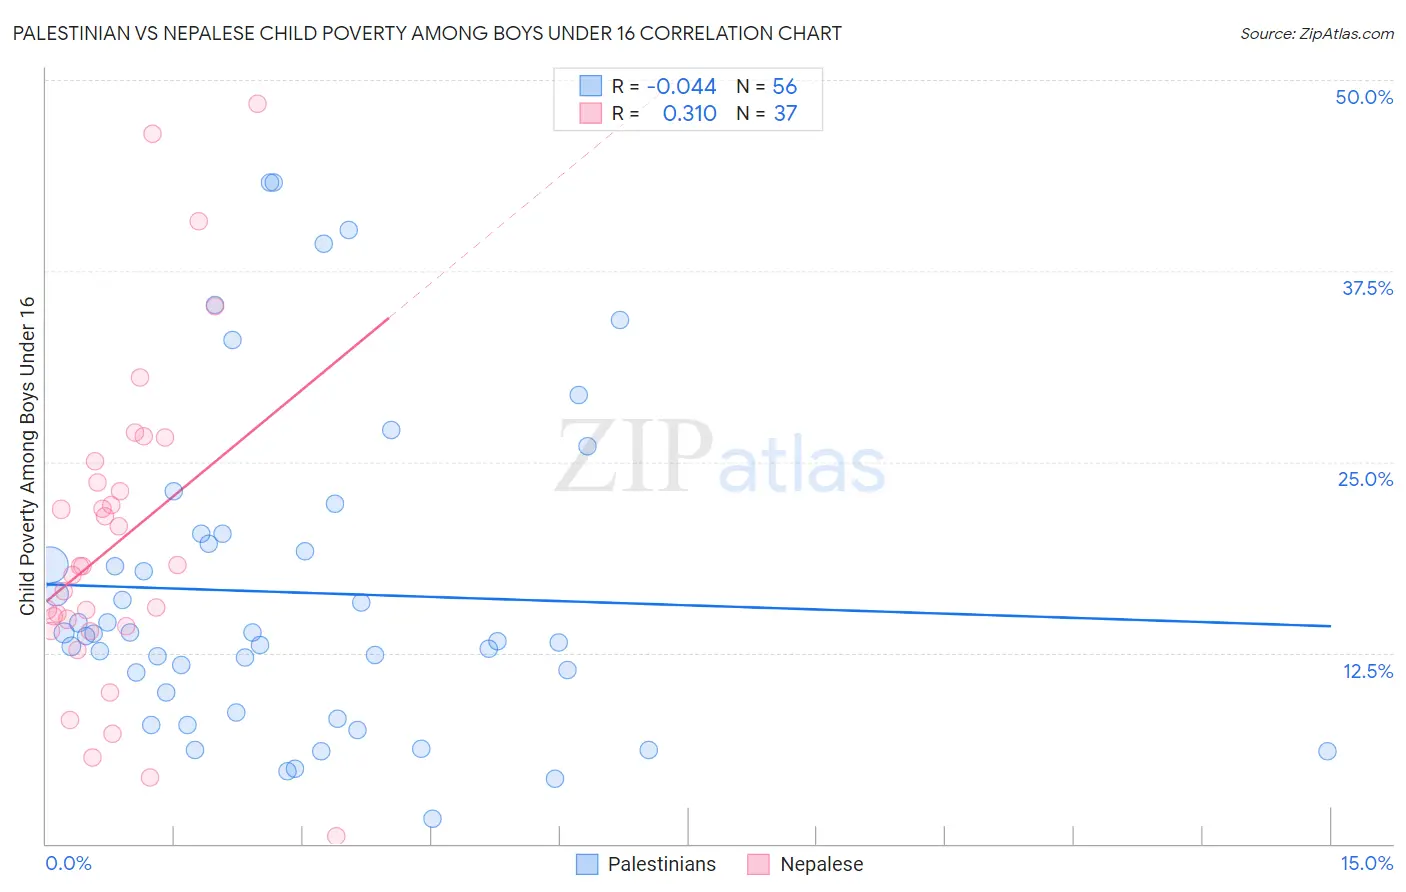
Palestinian vs Nepalese Child Poverty Among Boys Under 16 Correlation Chart
The statistical analysis conducted on geographies consisting of 214,667,455 people shows no correlation between the proportion of Palestinians and poverty level among boys under the age of 16 in the United States with a correlation coefficient (R) of -0.044 and weighted average of 15.4%. Similarly, the statistical analysis conducted on geographies consisting of 24,516,782 people shows a mild positive correlation between the proportion of Nepalese and poverty level among boys under the age of 16 in the United States with a correlation coefficient (R) of 0.310 and weighted average of 18.0%, a difference of 17.2%.
Child Poverty Among Boys Under 16 Correlation Summary
| Measurement | Palestinian | Nepalese |
| Minimum | 1.7% | 0.48% |
| Maximum | 43.3% | 48.5% |
| Range | 41.7% | 48.0% |
| Mean | 16.4% | 19.8% |
| Median | 13.7% | 18.2% |
| Interquartile 25% (IQ1) | 9.2% | 14.1% |
| Interquartile 75% (IQ3) | 19.9% | 24.4% |
| Interquartile Range (IQR) | 10.7% | 10.3% |
| Standard Deviation (Sample) | 10.3% | 10.6% |
| Standard Deviation (Population) | 10.2% | 10.5% |
Similar Demographics by Child Poverty Among Boys Under 16
Demographics Similar to Palestinians by Child Poverty Among Boys Under 16
In terms of child poverty among boys under 16, the demographic groups most similar to Palestinians are Carpatho Rusyn (15.4%, a difference of 0.050%), Canadian (15.4%, a difference of 0.24%), Czechoslovakian (15.3%, a difference of 0.31%), Immigrants from Brazil (15.4%, a difference of 0.35%), and Mongolian (15.4%, a difference of 0.38%).
| Demographics | Rating | Rank | Child Poverty Among Boys Under 16 |
| Belgians | 93.1 /100 | #119 | Exceptional 15.2% |
| South Africans | 93.0 /100 | #120 | Exceptional 15.2% |
| Scottish | 93.0 /100 | #121 | Exceptional 15.2% |
| Immigrants | Malaysia | 92.8 /100 | #122 | Exceptional 15.3% |
| Immigrants | Norway | 92.3 /100 | #123 | Exceptional 15.3% |
| Tlingit-Haida | 92.2 /100 | #124 | Exceptional 15.3% |
| Czechoslovakians | 92.1 /100 | #125 | Exceptional 15.3% |
| Palestinians | 91.3 /100 | #126 | Exceptional 15.4% |
| Carpatho Rusyns | 91.1 /100 | #127 | Exceptional 15.4% |
| Canadians | 90.6 /100 | #128 | Exceptional 15.4% |
| Immigrants | Brazil | 90.3 /100 | #129 | Exceptional 15.4% |
| Mongolians | 90.2 /100 | #130 | Exceptional 15.4% |
| Immigrants | Western Europe | 90.0 /100 | #131 | Exceptional 15.4% |
| Immigrants | Kazakhstan | 88.7 /100 | #132 | Excellent 15.5% |
| Welsh | 88.3 /100 | #133 | Excellent 15.5% |
Demographics Similar to Nepalese by Child Poverty Among Boys Under 16
In terms of child poverty among boys under 16, the demographic groups most similar to Nepalese are Inupiat (18.1%, a difference of 0.41%), Cuban (17.9%, a difference of 0.47%), Pennsylvania German (17.9%, a difference of 0.56%), Immigrants from Africa (18.1%, a difference of 0.57%), and Bermudan (18.1%, a difference of 0.67%).
| Demographics | Rating | Rank | Child Poverty Among Boys Under 16 |
| Japanese | 5.5 /100 | #217 | Tragic 17.7% |
| Iraqis | 5.5 /100 | #218 | Tragic 17.7% |
| Sierra Leoneans | 5.3 /100 | #219 | Tragic 17.8% |
| Immigrants | Cambodia | 5.1 /100 | #220 | Tragic 17.8% |
| Immigrants | Panama | 4.3 /100 | #221 | Tragic 17.9% |
| Pennsylvania Germans | 3.9 /100 | #222 | Tragic 17.9% |
| Cubans | 3.8 /100 | #223 | Tragic 17.9% |
| Nepalese | 3.2 /100 | #224 | Tragic 18.0% |
| Inupiat | 2.7 /100 | #225 | Tragic 18.1% |
| Immigrants | Africa | 2.6 /100 | #226 | Tragic 18.1% |
| Bermudans | 2.5 /100 | #227 | Tragic 18.1% |
| Immigrants | Nonimmigrants | 2.2 /100 | #228 | Tragic 18.2% |
| Immigrants | Micronesia | 1.8 /100 | #229 | Tragic 18.3% |
| Fijians | 1.8 /100 | #230 | Tragic 18.3% |
| Nicaraguans | 1.4 /100 | #231 | Tragic 18.4% |